

Louisville’s Civic Data Alliance looks into the matrix of raw data streaming all around us and finds stories that help improve local government, citizen groups, and our communities and neighborhoods. The two year old group is Louisville’s local Code for America volunteer team and organizer of the annual hackathon on our nation’s Day of Civic Hacking.
Pat Smith (@CityResearch) is one of the alliance’s co-leaders, and was one of a four-person team—along with Ate Poorthuis (@atepoorthuis ), Michael Schnuerle (@metromapper), and Bret Walker (@LouieWatch)— who recently put together a map of Jefferson County showing voter turnout from last May’s primary elections.
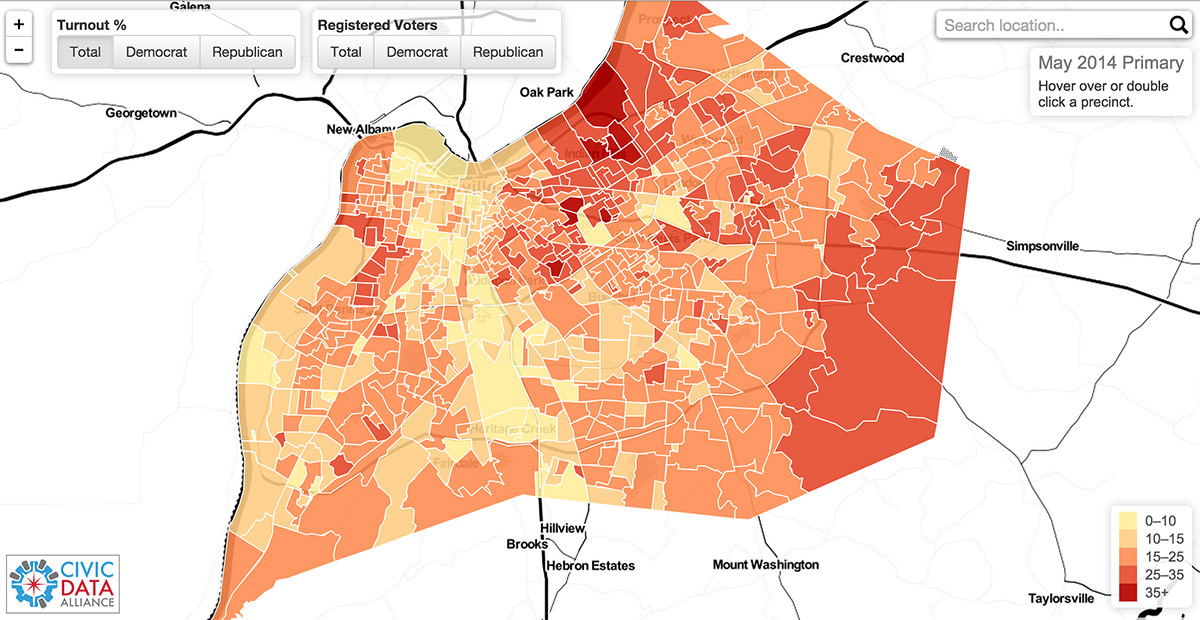
Overall primary turnout in Louisville tallied 19.6 percent, below the state’s 26.9 percent turnout, but observers are expecting next week’s general election turnout to be higher than usual due to the senate race. This week, Smith explained to me why the voting data is important for getting out the vote next Tuesday and how data can make us more informed citizens.
Broken Sidewalk: Why are turnout numbers important, and especially important to visualize? What do they show about how tuned in the city is with what’s happening politically?
Pat Smith: These turnout numbers from last May give us a sense of the level of civic engagement across communities. High voter turnout is a measure of public confidence in government and willingness to actively take part in a democratic process. The figures on our map depict turnout for last May’s Primary Election. Since Primary Elections typically have much lower turnouts than General Elections, we expect levels of voter turnout to be increased when the statistics from next Tuesday’s Mid-Term become available. But while the numbers will be higher, we expect the overall pattern to remain mostly the same next Tuesday, where areas with more wealth and older populations tend to have higher turnout, and where areas with high poverty rates and less civic capacity have less.
What’s the biggest takeaway you have from the turnout visualization and what does it mean for Louisville?
We’re really hoping that local groups that are trying to “Get Out the Vote” next Tuesday find this a useful tool to help guide their efforts. This map shows places across Louisville where canvassers might have the greatest impact as they seek to engage with voters and in encouraging the disengaged to get to vote. Groups working to get out the vote at the neighborhood level, door-to-door, are essential in building and rebuilding trust and interest in our political process.

What do you make of the low turnout rate in much of the urban areas of Louisville such as Downtown, Portland, SoBro, and Old Louisville? What implications on the urbanism of the neighborhoods does this have? (Especially in light of the high portion of registered voters these areas have.)
There are a lot of reasons why people might become disengaged from the voting process. I think trust in the system is a big issue, lower income populations are sometimes subject to various methods for voter disenfranchisement. But it’s also a simple economic reality related to opportunity and time management, like having difficulties arranging for child care while working more than one job. Whatever the reasons that voter turnout is lower in the core, it really helps to be able to visualize the pattern, and to continue thinking about supporting community building efforts in areas with very low turnout.
How can this map and the knowledge it visualizes help to change the engagement of Louisville citizens?
Other than helping canvassers target their effort before next Tuesday, we hope that individual citizens will see the turnout for the precinct they live in, and are inspired to take action to work toward higher voter turnouts on election day in their own neighborhood.

