

 In some of our earlier work last year, we examined the effects of absentee property and housing ownership in Lexington in relation to the problem of vacant and abandoned properties. Unsurprisingly, some of the city’s most troubled and neglected properties exist as just one among many on the ledger sheets of the city’s major property owners, many of whom live outside of the neighborhoods where they own property, or even outside of Lexington altogether.
Taking some inspiration from the radical geographer Bill Bunge’s 1969 map of non-local land uses in Detroit (and a contemporary re-working from the folks at Detroitography), we wanted to map out the bigger picture of non-local property ownership in Lexington.
It’s important to keep in mind that absentee property ownership operates at multiple scales. Absenteeism can take place between two neighborhoods in the same city, between adjacent cities, or between cities in completely different states or countries thousands of miles away.
For the purposes of this analysis, we’ve chosen to look simply at properties that have listed owner addresses outside of Lexington, thus our preference here for the more simplistic terminology of “non-local ownership.” Even if Lexington isn’t facing a speculation crisis on the same scale as Detroit, or the kind of influx of international capital into luxury real estate in cities like Vancouver, London, or New York City, non-local ownership of property is still a key dynamic that shapes the city’s development.
Non-local ownership is particularly important because it represents what the urban planner Kathe Newman has called the process of “de-linking property from place,” as the value of properties flows outside of the city and community, with the property’s exchange value elevated in importance over its potential use value to local people.
There are a total of 109,929 parcels of property in Lexington. Of these, we identified 10,466 that have listed owner addresses outside of the city, representing 9.5 percent of the city’s total number of parcels and 18.3 percent of the city’s total land area. Of these non-locally owned properties, 70.8 percent are owned outside of the contiguous counties to Fayette, though only 56 properties are owned outside of the country altogether.
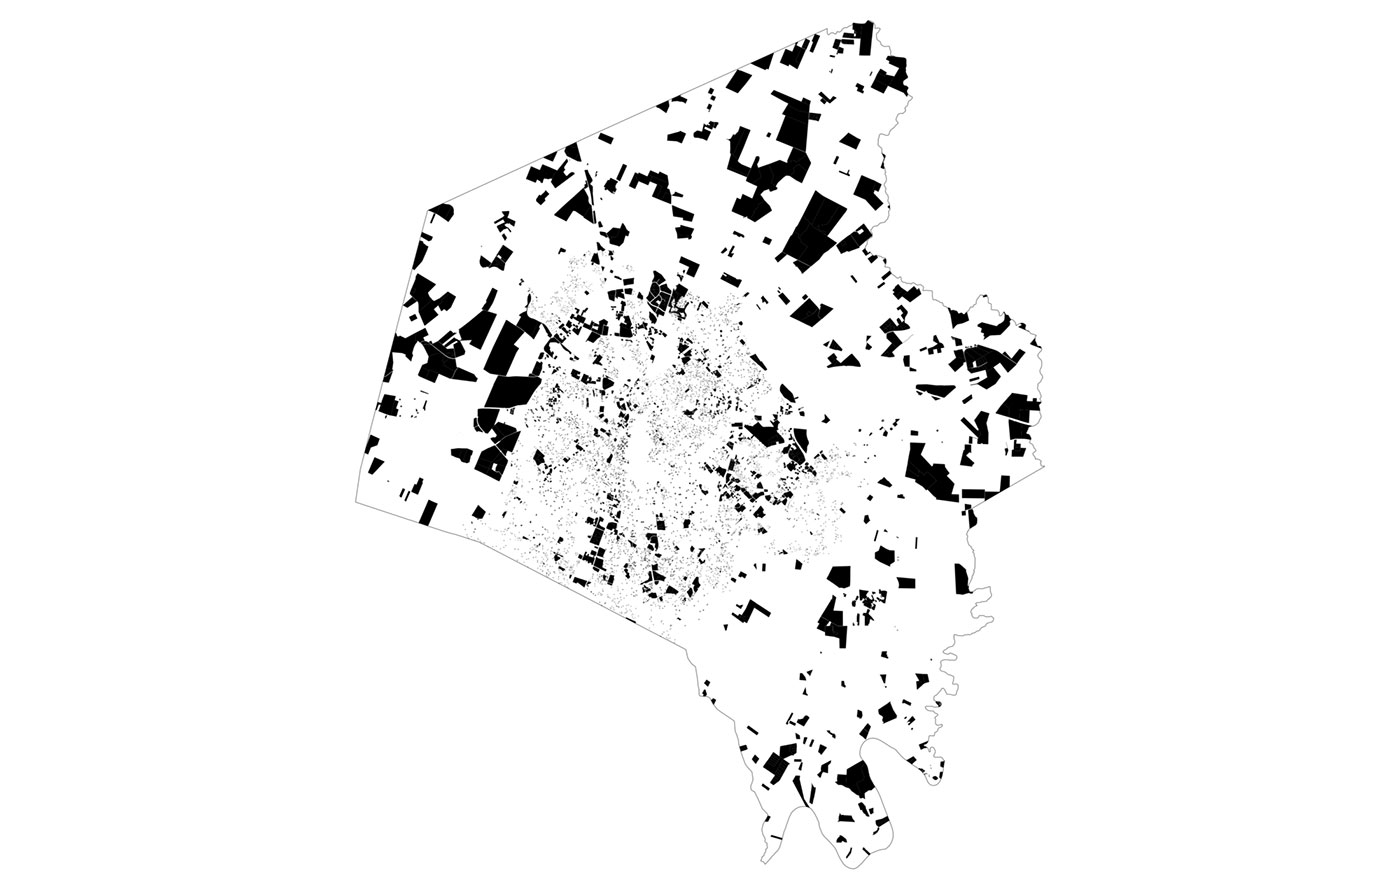
But while property ownership in general is important, we’re particularly interested in the question of housing. So looking at just the 98,209 parcels classified as either “residential” or “multi-family” properties, we see 8,308, or about 8.5 percent, of these being owned outside of the city.
Based on the overall rates of non-local ownership across property types, we can thus see that residential properties are actually less likely to be owned outside of Lexington — or even the contiguous counties — than other types of property. Indeed, 17.4 percent of all farm properties in the city are owned non-locally, as are 24.9 percent of all of Lexington’s commercial properties.
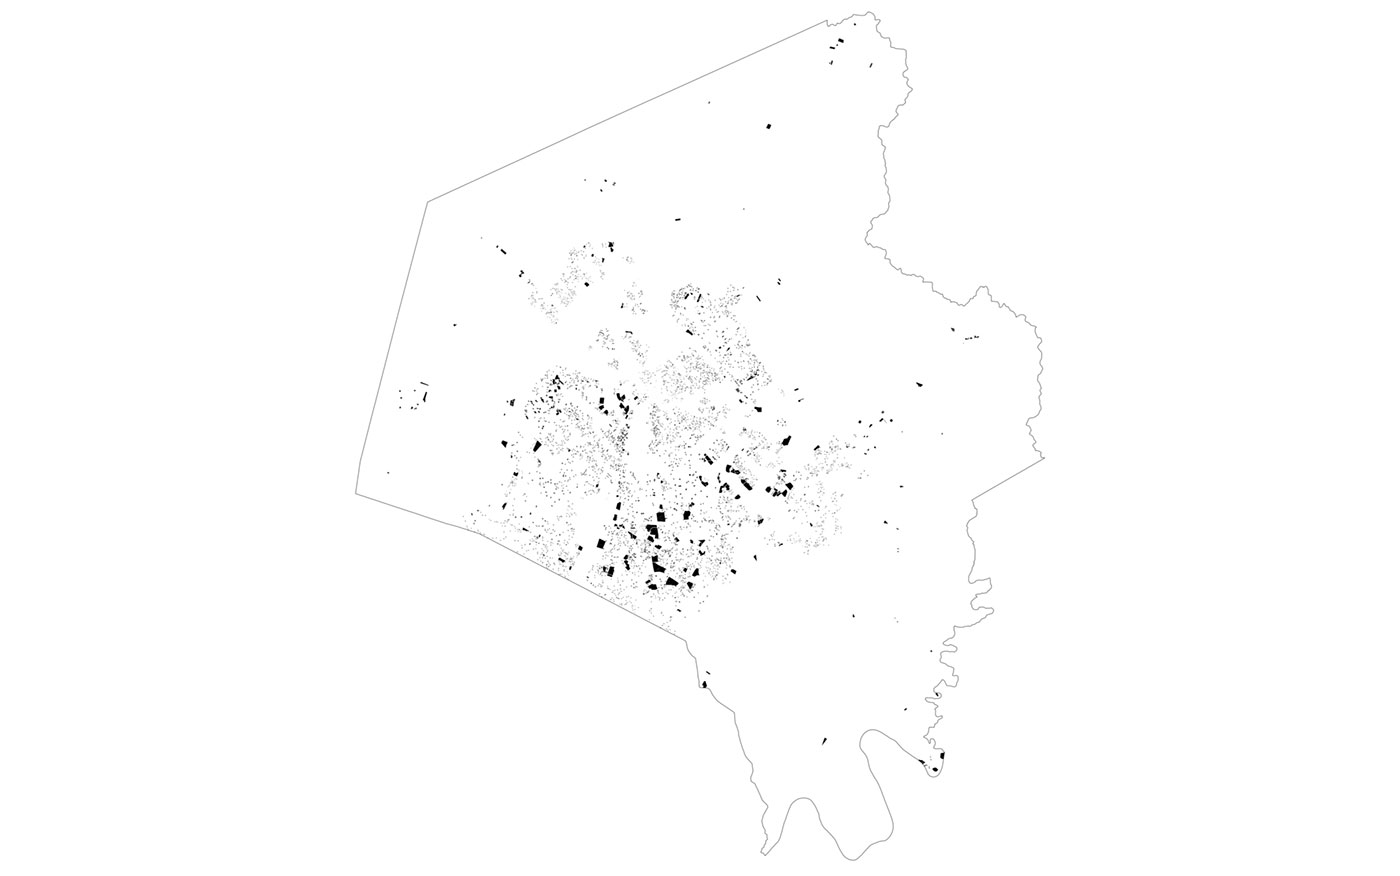 Non-local housing ownership: All residential properties with owner addresses outside the city of Lexington. (Lexington Housing Studies)
The question of non-local ownership, however, remains closely connected to the issue of concentrated property ownership. When many properties are owned by a single individual, this gives them significantly greater power to affect the local housing market with only their own actions within it — whether it be through setting the going rent for apartments or driving up sales values through flipping. This is increasingly the case in northeast Lexington, where gentrification continues apace thanks to the ability of a handful of actors to gobble up lots of property in a relatively small area.
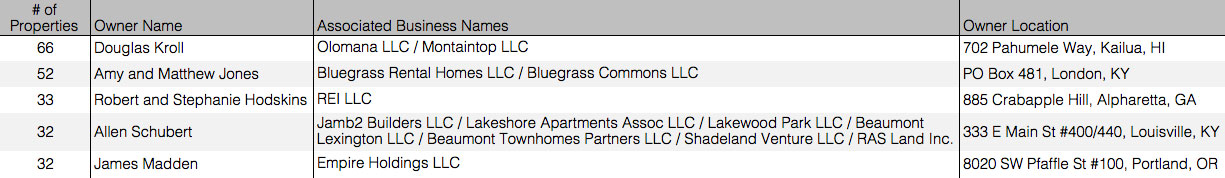
In order to understand the overlaps between non-local and concentrated ownership, we identified all residential properties in Lexington that are owned by individuals or companies who own a total of 10 or more residential properties. Excluding properties owned by subsidiaries of the U.S. Department of Housing & Urban Development (HUD), as well as any number of financial institutions, this yielded a total of 961 properties owned at 53 different addresses by 52 different ownership groups outside of Lexington.
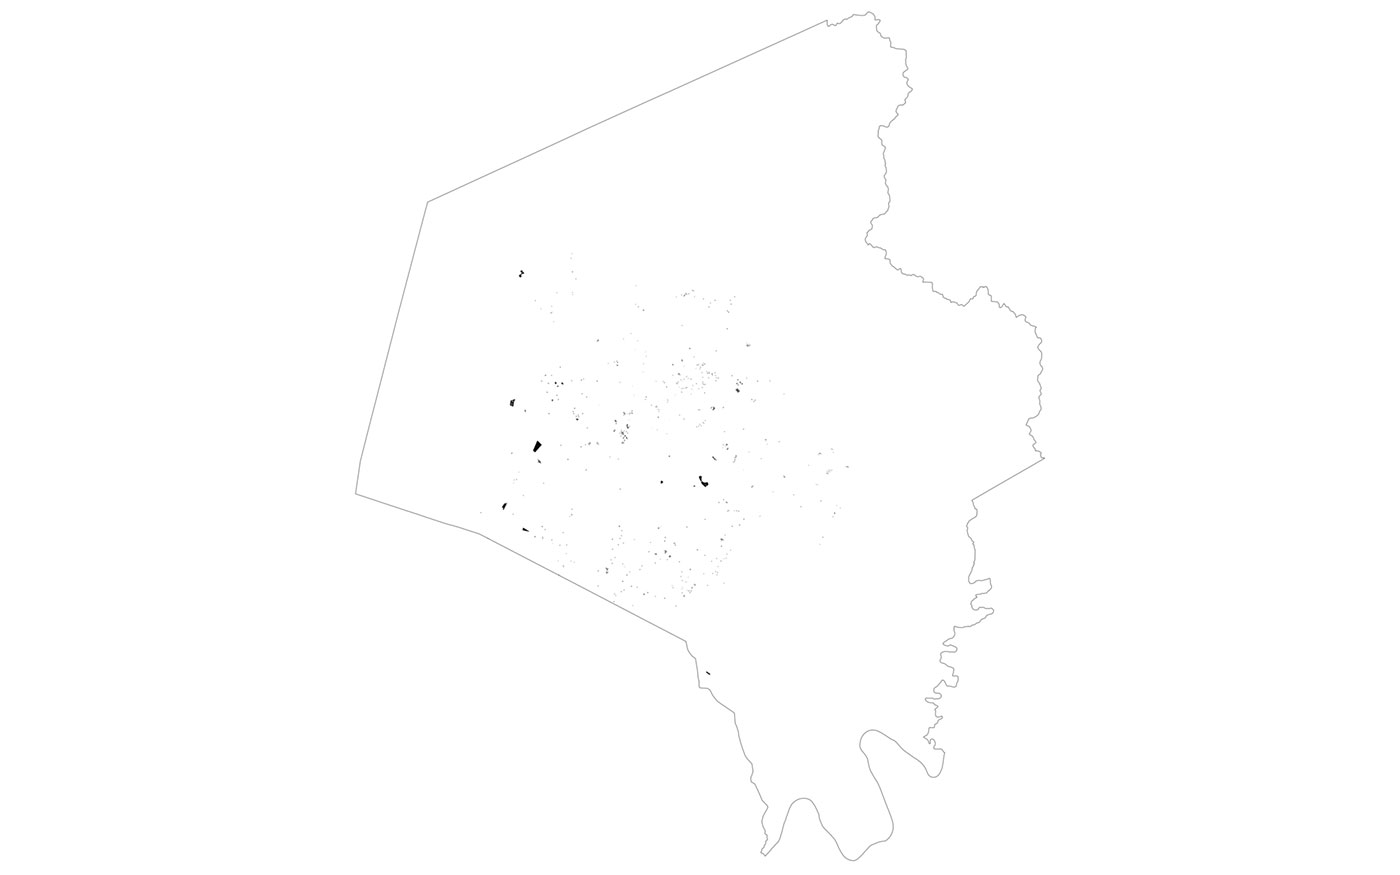
Five of these 52 owners own more than 30 properties in the city, with three of these being located outside of the state altogether. Indeed, the largest single non-local property owner is Douglas Kroll whose properties are registered to an address on the island of Oahu in Hawaii.
Of the 53 locations that these concentrations of ownership are located, just 11 are out of state, so it’s notable that three of these 11 are among the largest owners. Beyond the owners in Hawaii, the Atlanta suburbs, and Portland, OR, Lexington’s concentrated property owners are located in places like Ona, West Virginia, Lakewood Ranch, Belleair Beach and Palm Coast, Florida, Livingston, Tennessee, Martinsville, Virginia, and even Los Angeles, California and Brooklyn, New York.
Across these 53 owners and 961 properties, there’s no clear spatial pattern that applies equally to all — non-local, concentrated ownership of residential property is fairly diffuse and affects all parts of the city. The largest cluster of these properties, however, appear to be in the area along Nicholasville Road across from the University of Kentucky campus, stretching from State Street to Westwood Drive, where properties owned by REI LLC in Alpharetta, GA are concentrated. But since the relatively small number of parcels on the map make the patterns a bit difficult to see, we aggregated the parcels to the census tract level and calculated the odds ratio, as visualized in the map below.

In short, the odds ratio quantifies whether the value for a given area — in this case, the number of residential properties owned by non-local, concentrated owners — exceeds what one would expect for that area based on the ratios across the whole city.
A value of 1 would indicate that the number of these properties as a proportion of the total number of residential properties is the exact same as the citywide ratio, while values above 1 indicate a much greater concentration of these types of properties than one would expect, and vice versa for values below 1.
So not only can we confirm the raw concentrations of these properties along Nicholasville Road, but we can also say that Census Tract 18, where most of these are located, has nearly 11x more of its residential property controlled by non-local, concentrated owners than one would expect, the highest such value across the city.
Moving farther into the center of the city, Census Tract 9 and Census Tract 1.01 also have high odds ratio values, owing in part to the cluster of properties owned by Douglas Kroll near the intersection of High and Rose.
While we haven’t yet delved into the subject here at LHS, this map points towards the need to consider that one of the groups most affected and exploited by absentee, concentrated landlords in Lexington are students living near the University of Kentucky campus, a finding that should surprise absolutely no one with any awareness of the city’s housing situation.
[This article was cross-published from research group Lexington Housing Studies. It appears here with permission. Top image by Jwombles / Flickr.]

