[Editor’s Note: This is one piece in a multiple-part series about street safety in Louisville as the city continues to roll out its three-year pedestrian safety campaign, Look Alive Louisville. View the entire series here.]
How did more than 30,000 annual motor vehicle deaths become something that most Americans accept as normal? A new paper by Boston University professor Itai Vardi tries to answer that question.

Vardi reviewed American attitudes toward the problem of traffic deaths, starting in the early era of automobile growth, when there was a great deal of “moral panic” about the carnage on the nation’s streets.
His work is in a similar vein to University of Virginia professor Peter Norton, whose book, Fighting Traffic, recounts how the forces of “motordom” reshaped American streets by changing how people thought about cars in the city. Like Norton, Vardi has identified key conceptual frameworks that eventually led people to adopt the “matter-of-fact” tone we use to discuss today’s staggering rate of traffic deaths.
Vardi’s research encompasses historical accounts from media outlets, auto and insurance industry publications, activist groups, and, eventually, federal safety agencies. Here are three big factors that, according to Vardi, shaped the modern American view of traffic violence.
1. Thinking of traffic deaths in terms of fatalities per mile driven
Vardi says early, passionate accounts of traffic deaths framed the problem in terms of individual tragedies — the death of a child, for example — or listed the total number of annual casualties. Implicit in these reactions was a fundamental uncertainty about the widespread adoption of cars and their place in cities.
Emphasizing the total number of fatalities or individual cases dramatized the issue and often led to bold headlines. The Los Angeles Times editorial board, for example, told readers in 1922: “Blame the buzzwagon for nearly 15,000 violent deaths in America last year.”
For obvious reasons, car companies and car enthusiasts were threatened by that kind of outcry. Auto industry publications preferred to frame the problem in terms of deaths per mile traveled. This way the industry could emphasize safety improvements and downplay the danger of allowing driving to become widespread.
Eventually auto industry advocates were able to advance their framework and silence “moralist” objections to the expansion of automobility. A big victory for the auto industry came in 1924, Vardi reports, when the National Conference on Street and Highway Safety, convened by President Herbert Hoover, agreed to adopt the National Automobile Chamber of Commerce’s preferred safety metric: fatalities per vehicle.
Later, when federal agencies like the National Highway Traffic Safety Administration were formed to address the problem, they embraced the deaths-per-mile metric — in part, Vardi says, because it helped demonstrate that the agencies’ programs were having an effect.
Vardi says fatalities-per-mile “remained through these years the central statistical means by which to demonstrate progress in safety or counterbalance alarmist claims about accidents.”
There’s a vast gulf between the moral urgency of the Los Angeles Times 1922 headline and a modern NHTSA report. In the 1990s, an update from the agency read: “1992 was a very good year for traffic safety … on a vehicle-miles traveled basis, it was the best ever.” That year, 39,250 people were killed in traffic.
2. “Saving Lives”
Once federal agencies were created and charged with reducing motor vehicle deaths, they began using statistical forecasting to predict how many lives would be lost in the future. This allowed agencies like NHTSA to compare the forecast to actual traffic deaths and claim the difference was “lives saved” by their programs.
Vardi calls “saving lives” — which is actually part of NHTSA’s motto — “a rhetorical device to meet institutional goals.”
Forecasting future deaths, Vardi writes, also sidesteps the tricky question of what is an acceptable number of deaths.
This statistical exercise “advances ideas of normal or reasonable death rates, which… may downplay mass carnage,” says Vardi.
The framework “risks furthering the construction of the problem as one that can only be affected to a measured extent, never systemically,” he writes. “More radical challenges to the socio-technical arrangements that regularly produce mass casualities” — calls for less driving altogether, for example — “are omitted from the conversation.”
3. Seatbelts and Drunk Driving
Finally, once highway safety was placed in the hands of “dispassionate” federal agencies, they framed the problem as one of individual mistakes or mechanical failures, rather than systemic flaws. This paradigm was, ironically, advanced by the Ralph Nader–led reforms of the ’60s aimed at car manufacturers, Vardi says.
For example, the top chart, published in 1933 by the Travelers Insurance Company, omits structural contributions to the high rate of traffic deaths — such as street design and poor non-automotive travel options.
As Vardi writes, absent from these charts is “the growing reliance on automotive transportation at the expense of other modes of conveyance, the culture of speed, the marketing messages that encourage risk-taking, the mythologization of the automobile as a sublime technology, the constructed symbiosis between personal identity and one’s car.”
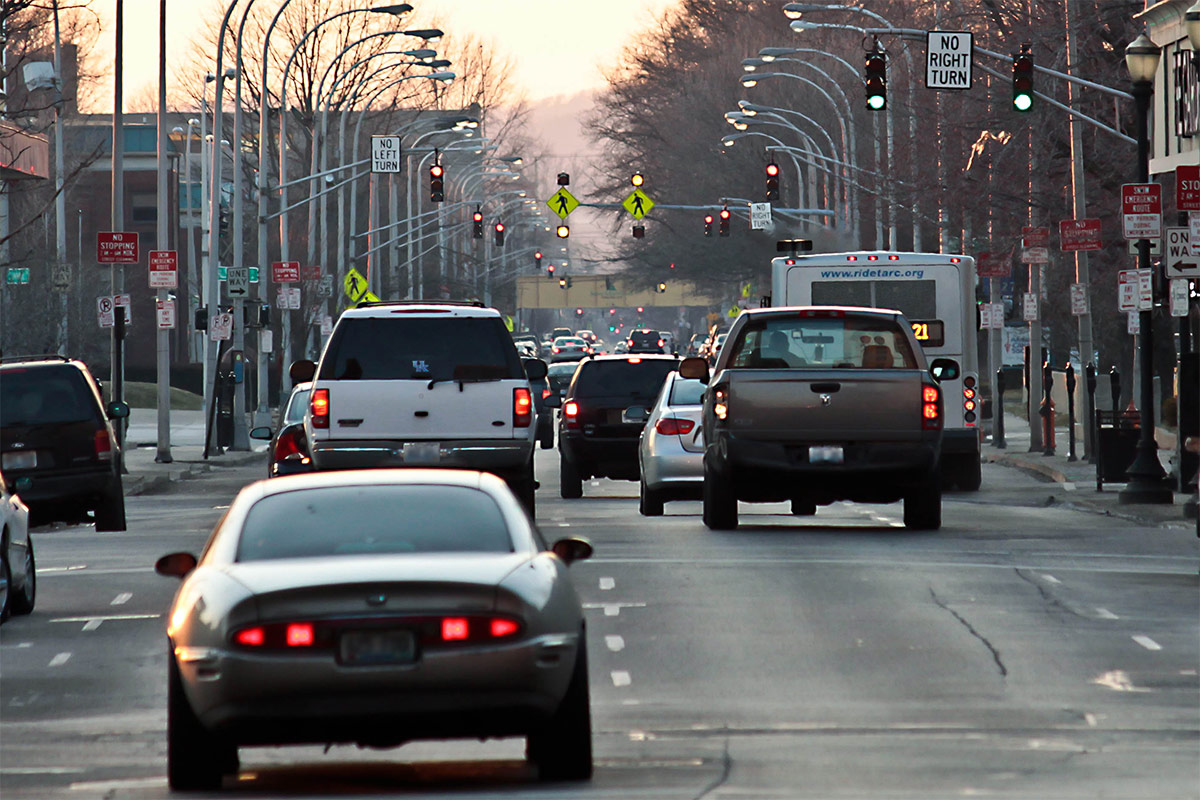
[Editor’s Note: This article was cross-posted from Streetsblog USA. It appears here with permission. Top image by Ed Devereaux / Flickr.]


