Infographics
Anatomy of a Protected Bike Lane: Infographic shows overwhelming benefits of...
Have you ever pedaled along a real Protected Bike Lane? A bike lane separated from the stress of fast-paced streets filled with speeding motorists...
36 Miles exhibition explores the impact of the Ohio River on...
The Ohio River is the reason we're all here, really. Had it not been for that 25 foot drop in elevation we call the...
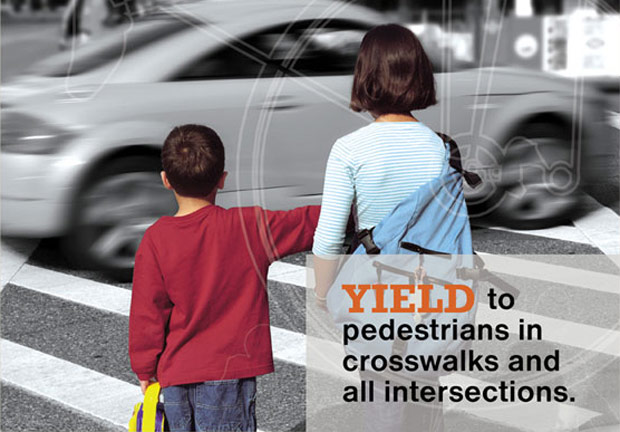
Infographic: How to Drive Safely by Bike Louisville
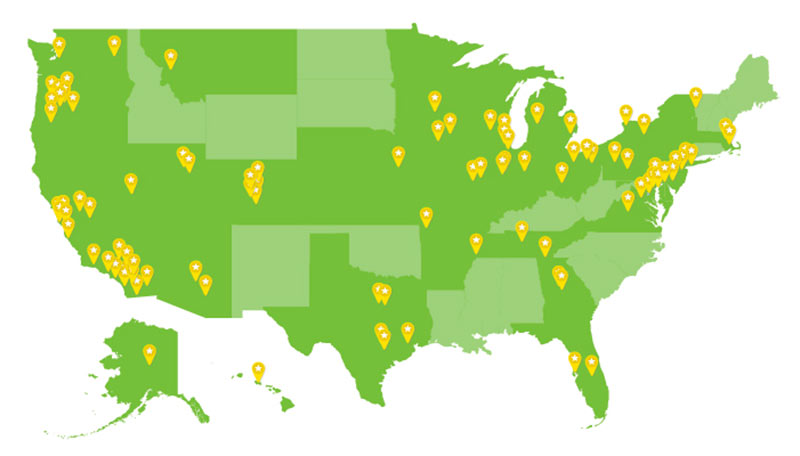
Bike Louisville has created a pretty fancy infographic and it's on display at a drivers license center near you.
Here's what they're up to:
Bike Louisville...
Infographic: UPS Worldport by the Numbers
The UPS Worldport is one of those remarkable things about Louisville. Because of the Worldport, Louisville's airport can claim to be "the 3rd busiest...
Infographic: Light Rail Transit for Dummies
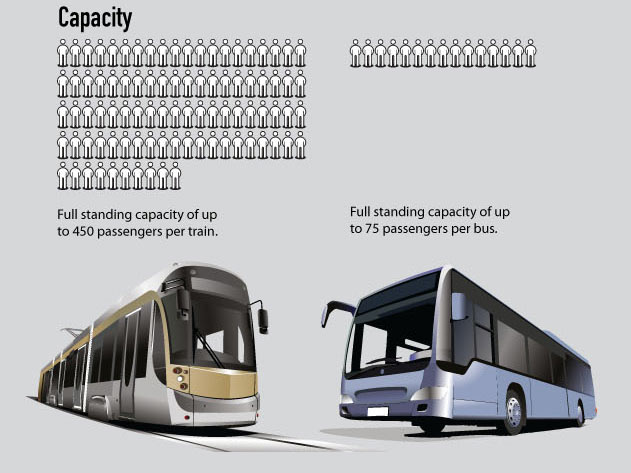
Waterloo, Canada is considering installing a light rail transit (LRT) system and Snapsort, a local Waterloo tech company, created this infographic to explain just...
Infographic: Land Use and Retail Frontage
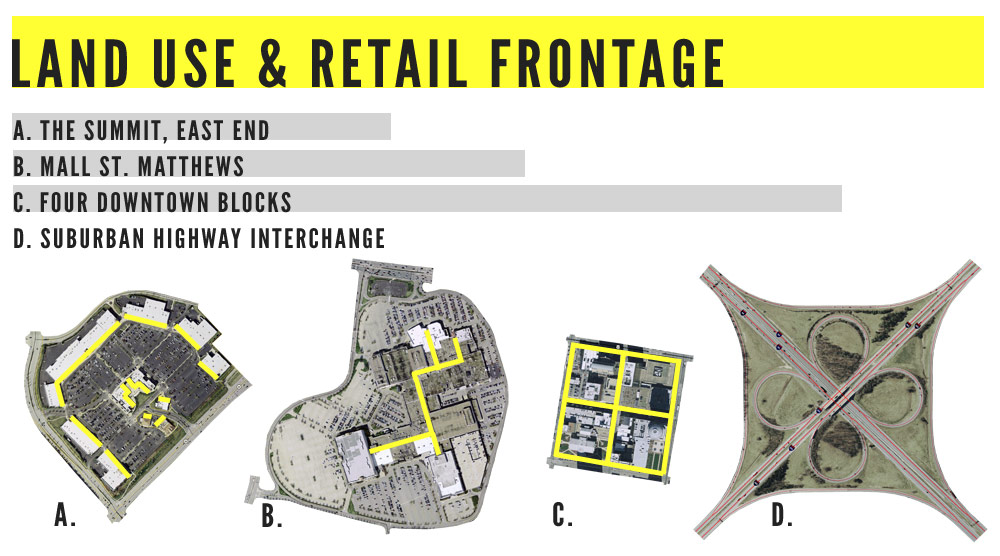
It's pretty interesting to compare the different space requirements of various urban typologies. In the example above, the yellow lines represent (potential) retail frontage...
Census Roundup: Mixed News for Louisville
It's that time of the decade when we're forced to get down off our tip toes and stand flat-foot against the door frame to...
Infographic: What Makes a Livable and Lovable City?
The Philips Center for Health and Well-being recently created this infographic looking into what makes a livable and lovable city. At its heart are...
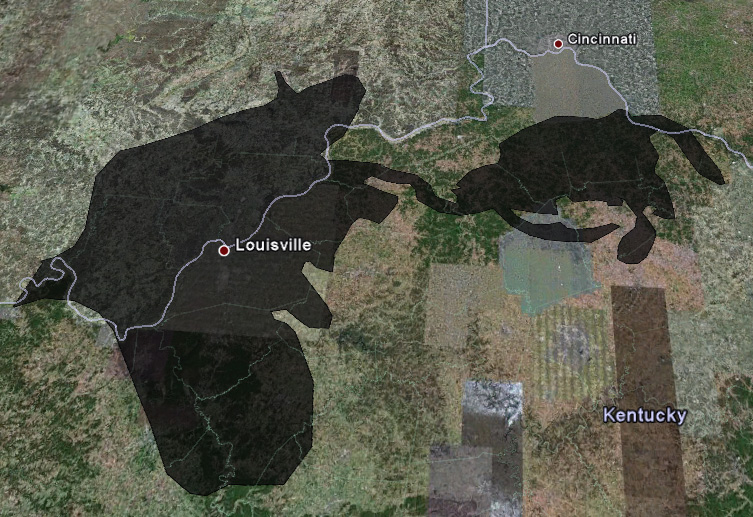
What If The Gulf Oil Spill Was In Louisville?
The massive Deepwater Horizon oil spill in the Gulf of Mexico has grown large enough to affect everyone, including Louisville, but how big is...

