

Louisville just wrapped up its 13th annual WorldFest, a celebration of multiculturalism held Downtown on the Belvedere. “Cities that embrace and encourage their international citizens and cultures will thrive, have a stronger quality of life and will attract new growth and jobs,” Mayor Greg Fischer said, describing the event in a statement. But when we’re not together celebrating, where do Louisville’s immigrants live?
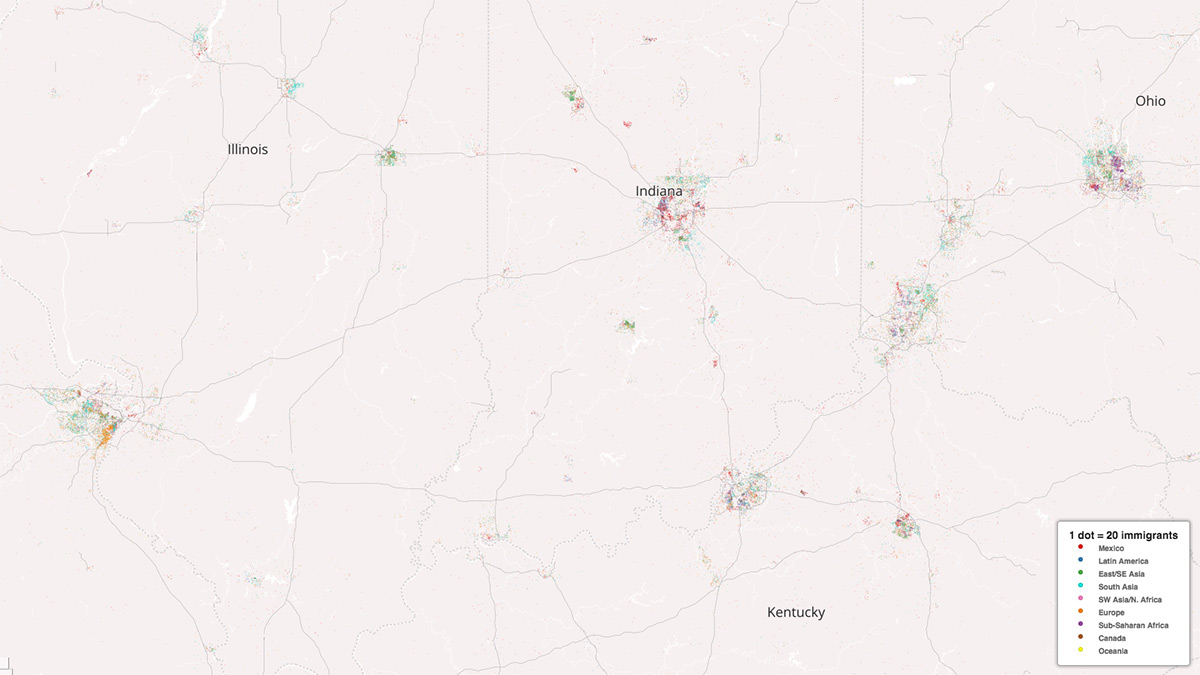
Texas Christian University Professor Kyle Walker has plotted the geography of immigration using Census tract data and colorful dots that reveal where immigrants call home across the country. Each dot on the map represents 20 immigrants.
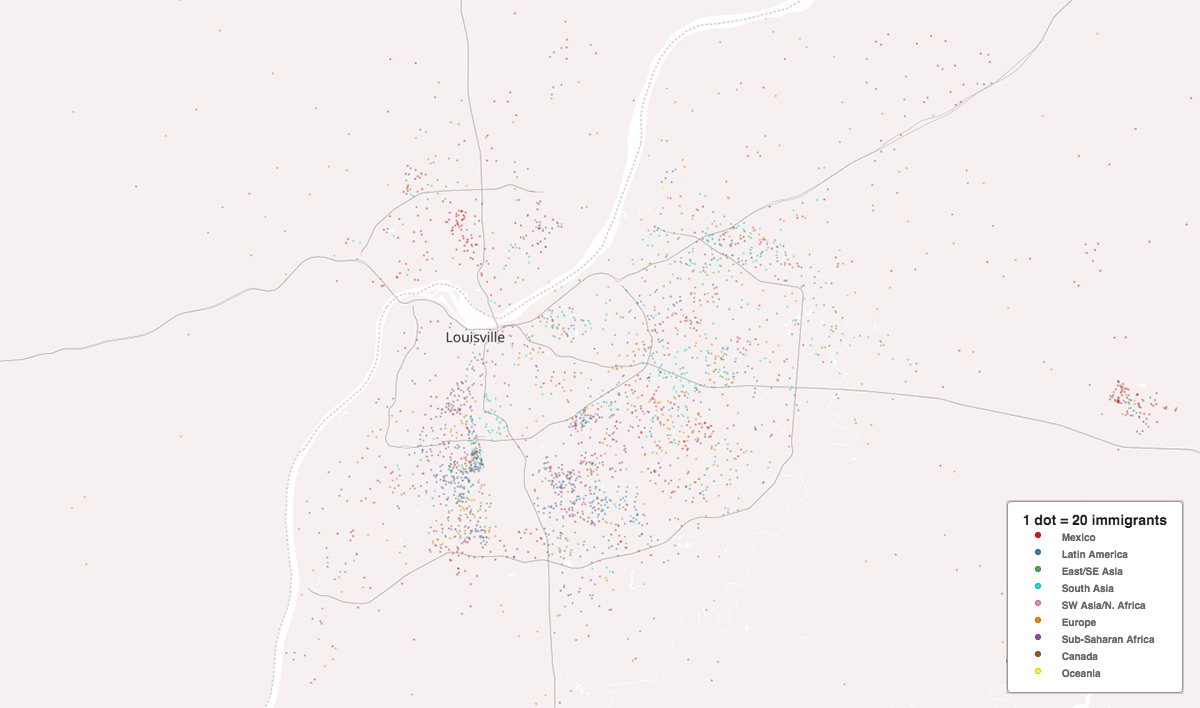
While Downtown Louisville is the symbolic heart of the city where we come together for major community events like WorldFest, it turns out not a lot of foreign-born Louisvillians live there.
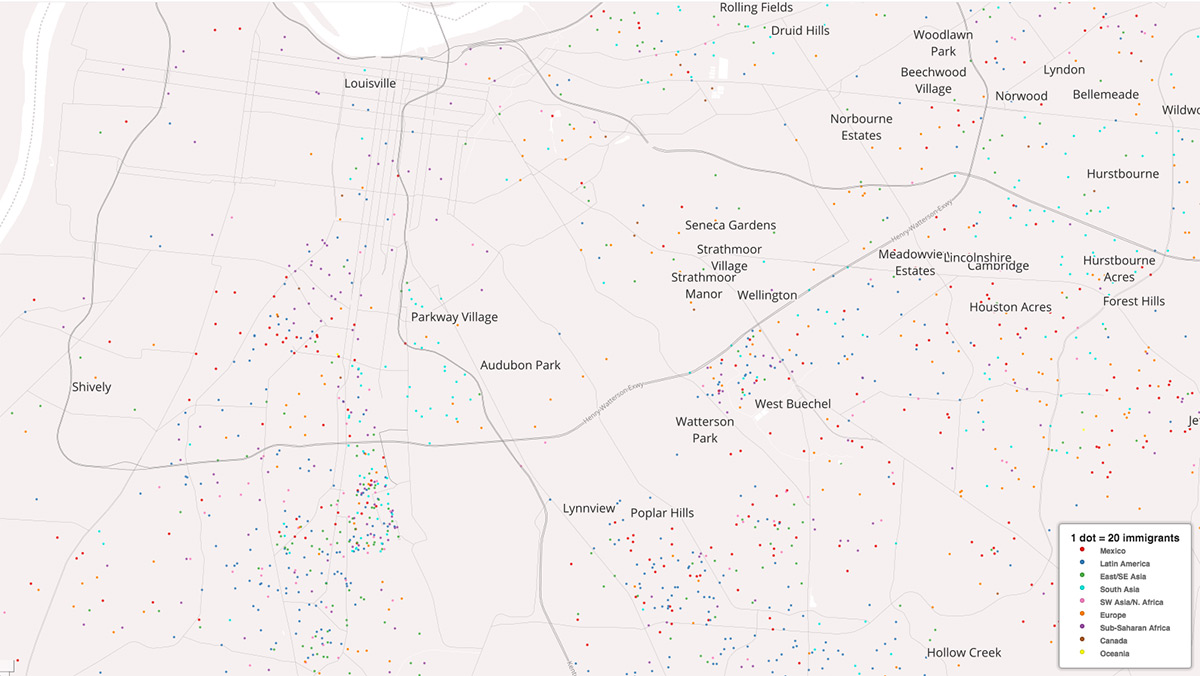
Louisville’s own geography of immigration reveals several insights about where immigrants live in the River City. Most surprising, more immigrants appear to live outside the Watterson, in the south and east portions of the county, than inside. The highest density of immigrants has been (see below) and continues to be along Southern Parkway in the Beechmont neighborhood. Share your observations in the comments below. Very few foreign-born Louisvillians are shown to live in the West End, the Highlands, or St. Matthews.
Historically, neighborhood names often revealed the geography of immigration, with places such as Germantown, Schnitzelburg, New Hamburg (now the Original Highlands), and Irish Hill among others.
Nationally, the Mapping Immigrant America project shows more immigrants tend to live in larger cities, which results in dense ethnic neighborhoods found in New York, Chicago, or Los Angeles. Louisville’s populations, by contrast, are located in less dense, suburban areas. Take a look at the population densities of several cities shown at the same scale below.
Walker used demographic data from the 2009–2013 American Community Survey at the Census tract level to create the map. “I stress that the map represents the ACS estimates of immigrant geography in the US subject to a margin of error, and in turn not where all immigrants are,” Walker wrote on the map website. “Having dots represent 20 immigrants mitigates the error somewhat as small counts are suppressed, but the estimates themselves are still error-prone and the effectiveness of this will be uneven from place to place.
Browse the map yourself here or read more about how the map was made here. You may also enjoy this map we previously covered that explored the geography of second languages in Louisville.

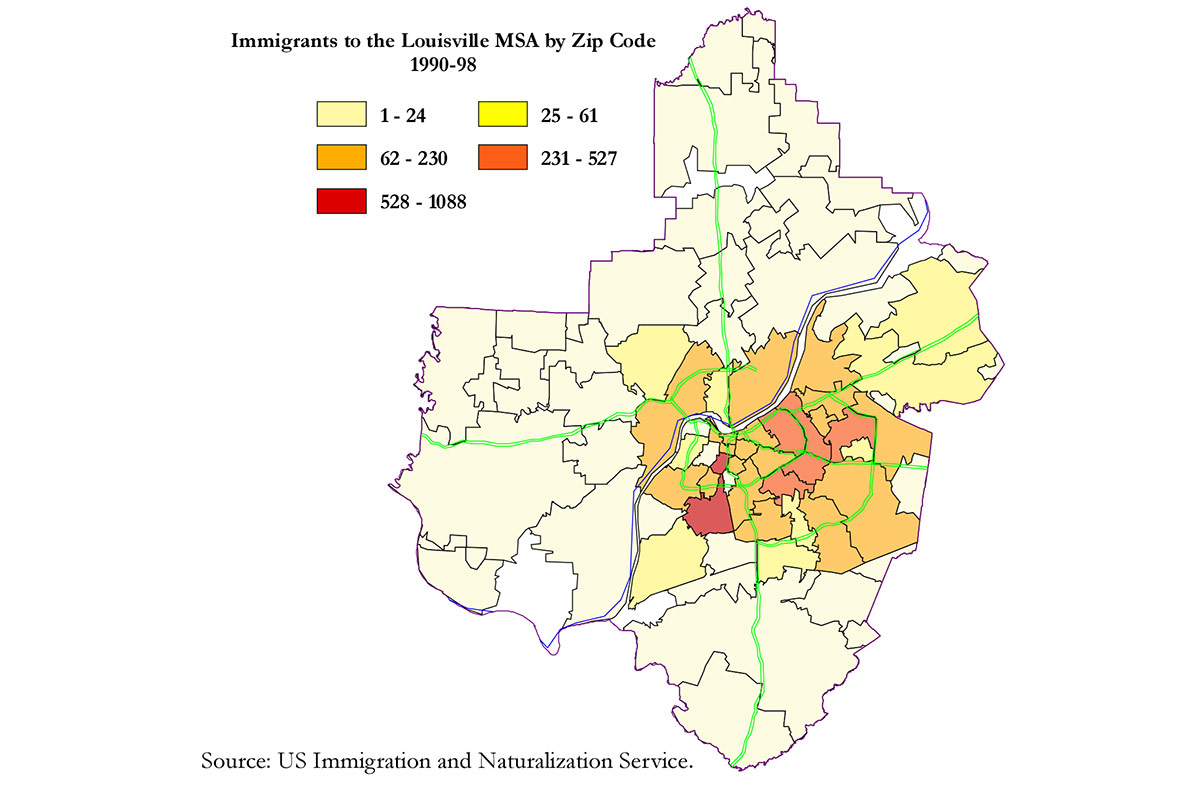
The dot map appears to reflect a 2001 report by Alexei Izyumov, Babu Nahata, and Paul Coomes, et. al. at the University of Louisville’s economics department called “Immigration to the Louisville Metropolitan Area: Trends and Characteristics.”
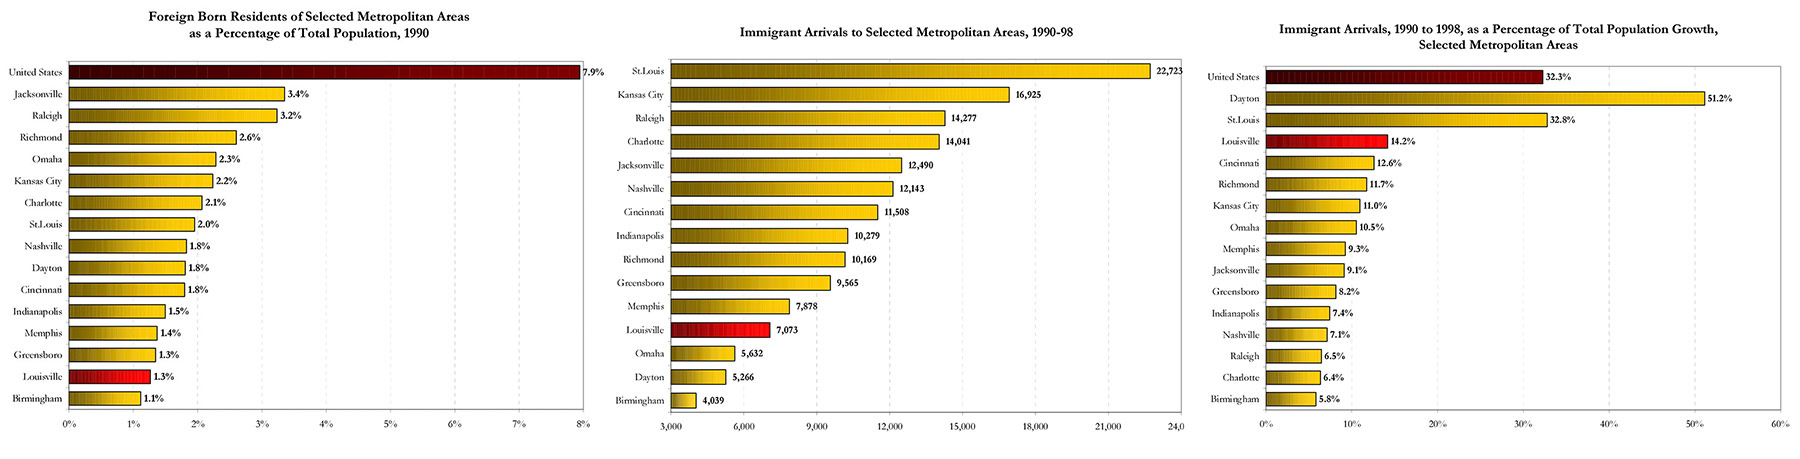
Among a plethora of data, the study shows how Louisville compared to other cities in terms of immigrant population in the 1990s. For instance, charts show that between 1990 and 1998, 1,073 immigrants moved to Louisville. In 1990, foreign-born residents made up 1.3 percent of Louisville’s metro area population. At the time, Raleigh was 3.2 percent, Kansas City was 2.2 percent, and Indianapolis was 1.5 percent. The national average was 7.9 percent. Despite having lower numbers of immigration and percentage of overall population, immigrants did make up a higher portion of the city’s population growth at the time than many similar cities.
A map produced for the report shows similar geographic trends as Walker’s maps above.
[Top Image: Crowds pack the Belvedere for Louisville’s WorldFest. Courtesy Metro Louisville.]


Edit that to Beechmont Neighborhood
Very interesting, but a slight correction: Beechwood -> Beechmont
I don’t know if my feelings are common but I enjoy the increasing diversity of peoples in the South End where I live. It has made the cuisine much more interesting, for starters. But ultimately what is really interesting are the new ideas and perspectives which I strongly believe will only add to the lifeblood of the community.
Comments are closed.