

Statistically, in the South you have a significantly higher chance of dying in a car crash than in other parts of the country. Why is this the case? Richard Florida dug into the numbers for the Atlantic‘s CityLab.
Florida highlights the “geography of car deaths in America” in two maps, the first based on the fatality rate from road crashes and the second showing road fatalities as a percentage of all fatalities. In both, there’s a clear “Car Death Belt,” as Florida puts it, comprising Southern states. Another group in the Great Plains also is in the red.
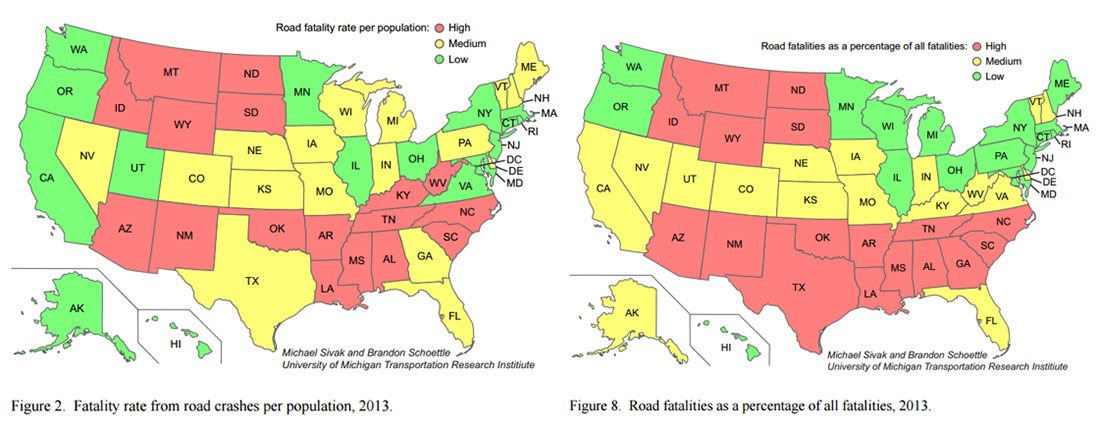
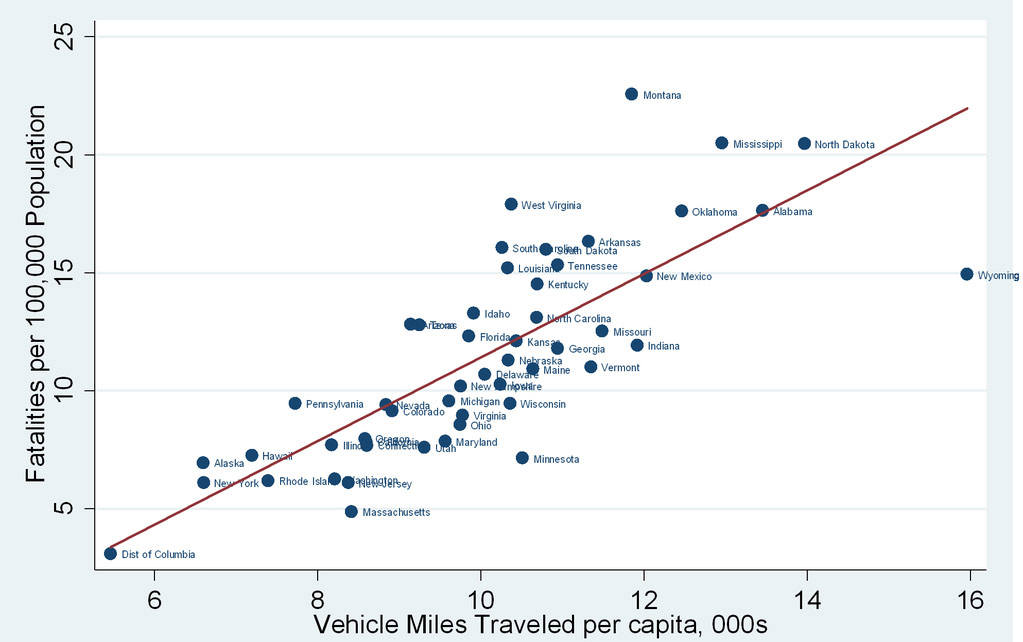
Kentucky ranks in the bottom third of states for fatality rate, but avoids the overall worst ten, topped by Montana, Mississippi, North Dakota, West Virginia, and Alabama. As a percentage of overall fatalities, Kentucky ranks in the middle third—not because the car crash fatality rate is lower but because there are other issues at play in the state. Again, the Great Plains dominates the worst list.
The states with the lowest car crash fatality rates included Washington, D.C., Massachusetts, New Jersey, New York, and Rhode Island—essentially the “Bos-Wash” corridor. Those same five comprised the top of relative road fatalities as well.
Florida’s numbers came from a new study from the University of Michigan Transportation Research Institute, headed up by Michael Sivak and Brandon Schoettle. According to Florida:
The study used data from the National Highway Traffic Safety Administration and the Center for Disease Control to map the death rate from road crashes on a per capita basis in 2013. There were a reported 32,719 traffic fatalities that year—a very concerning number, especially given that these deaths are largely preventable. Keeping them from happening requires knowledge of where they occur the most and why.
Florida points out that one of the chief differences in the best and worst groups is their level of urbanism, with Washington, D.C. being completely urban. The South and the Great Plains, on the other hand, are filled with rural settlement or wide open landscapes where speed is more likely to become a factor. He points to the higher availability and use of mass transit—from local subways and buses to Amtrak—in the Northeast Corridor versus the South that provides alternatives to driving.
To understand why the two red regions are statistically more dangerous, Florida makes a few observations on the data. “To get at this question, my Martin Prosperity Institute colleague Charlotta Mellander ran a basic correlation analysis to determine associations between road fatalities and certain key demographic, social, and economic factors,” Florida wrote. “It’s important to keep in mind that these correlations do not imply causation, but instead point to associations between variables.”
Here are some of his findings:
- Car crash fatalities are lower in dense, urbanized states.
- States with higher speed limits have higher fatality rates.
- Fatalities are higher in poorer states (based on GDP) and states with higher poverty rates. (Florida suggests this may be due to older cars with fewer safety features.)
- States with “high-tech knowledge-based economies” have lower fatality rates.
- “car deaths were higher in states where greater shares of workers are members of the blue-collar working class”
- Fatality rates follow lines of political ideology, with higher rates in conservative states. (This is likely due to political preferences to land use, with conservatives favoring less density, which we covered here.)
The analysis comes down to two main things: land use and speed. “This is not surprising since people drive more and faster in less populous states and less and slower in denser, more urbanized, and more populated states,” Florida wrote. “Many of the states with lower rates of road deaths have lower speed limits.”
[Top image: Driving into Downtown Louisville on Interstate 64 by Kevin Schraer / Flickr.]

