

[Editor’s Note: This is one piece in a multiple-part series about street safety in Louisville as the city continues to roll out its three-year pedestrian safety campaign, Look Alive Louisville. View the entire series here.]
Louisville is in the midst of a pedestrian safety campaign called Look Alive Louisville. And for good reason. The city’s pedestrian death rate is above the national average—last year alone, 18 pedestrians died on Louisville streets and another 483 were struck by motorists. The numbers speak for themselves.
But unsafe streets don’t just affect pedestrians—they’re dangerous for all of us whether we’re in a car, on a bicycle, or walking. A new report has found the number-one contributor to unsafe streets around the world is suburban sprawl—and the reliance on driving it requires—and it offers some recommendations on how to combat the deadly streetscapes that needlessly kill thousands every year.
This summer, the World Resources Institute (WRI) published its study, Cities Safer By Design, which explores how transportation design affects traffic safety. The policy research and analysis organization based in Washington, D.C. looked to major cities across the world to figure out what is and what is not working in creating safety in our streets.
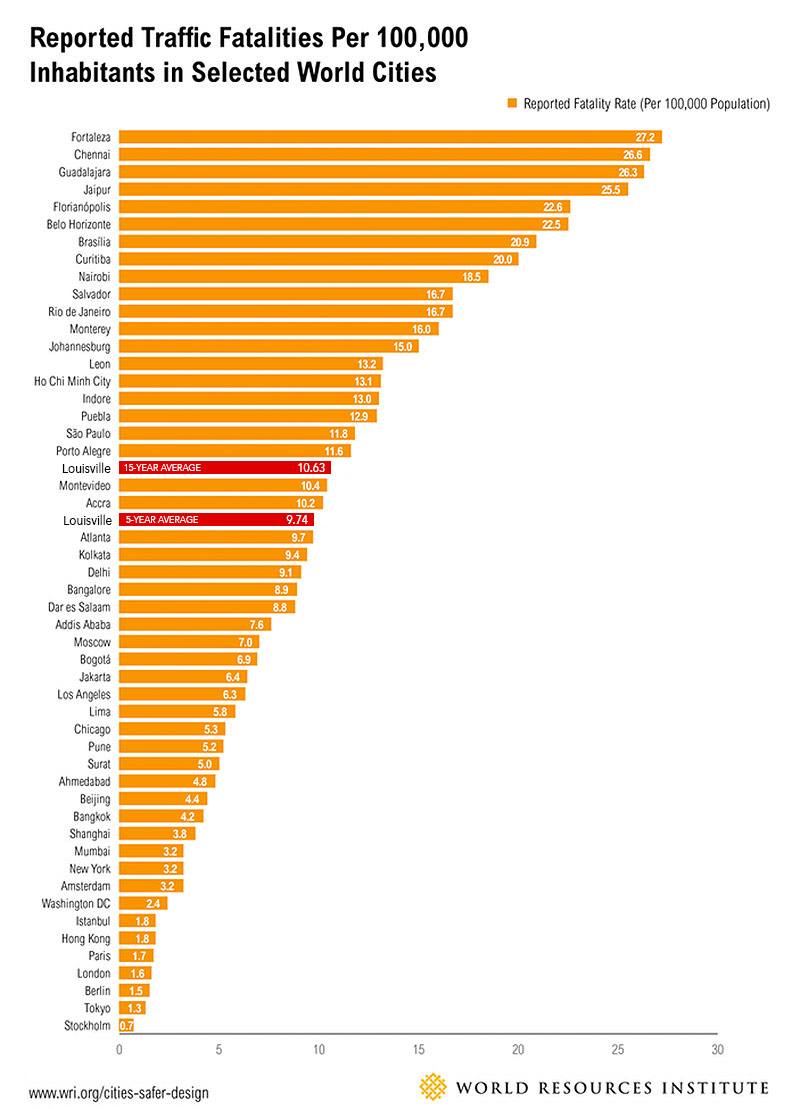
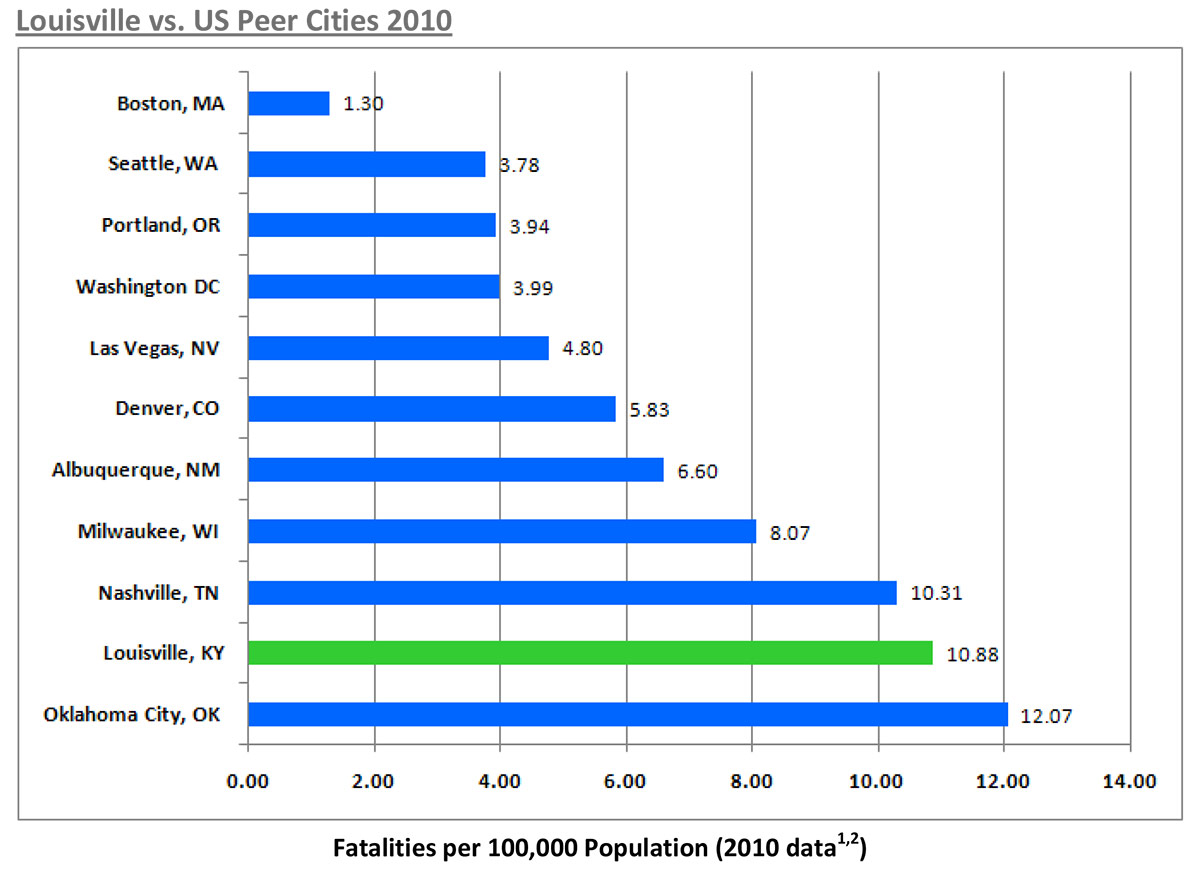
The report ranked cities by their traffic fatality rate per 100,000 people. Louisville was not part of the sample, but we calculated the city’s ranking to see where we stand and added us to the report’s chart based on 5-year and 15-year average traffic fatality rates.
It’s not a pretty picture. Louisville ranks worse than sprawling Atlanta in traffic fatality rate. Nearly twice as many are killed in Louisville per 100,000 residents than in Chicago, three times more than New York City, and quadruple the number as in Washington, D.C.
Internationally, Louisville’s safety numbers fall in line with cities like Montevideo, Uruguay; Accra, Ghana; and Kolkata or Delhi, India. We’re significantly more dangerous than places like Jakarta, Indonesia; Beijing or Shanghai, China; and Mumbai, India. World leaders in traffic safety—places like Stockholm, Sweden; Tokyo, Japan; and Berlin, Germany—experience a mere fraction of the death and injury on their streets as we do at home. Safer streets are possible.
But we already know that Louisville’s streets lag in safety. How can we improve them? Most agree than they need to be redesigned. As part of our ongoing series on street safety, we’ve already looked at infrastructure changes at Look Alive’s target intersections and explored different types of road diets.
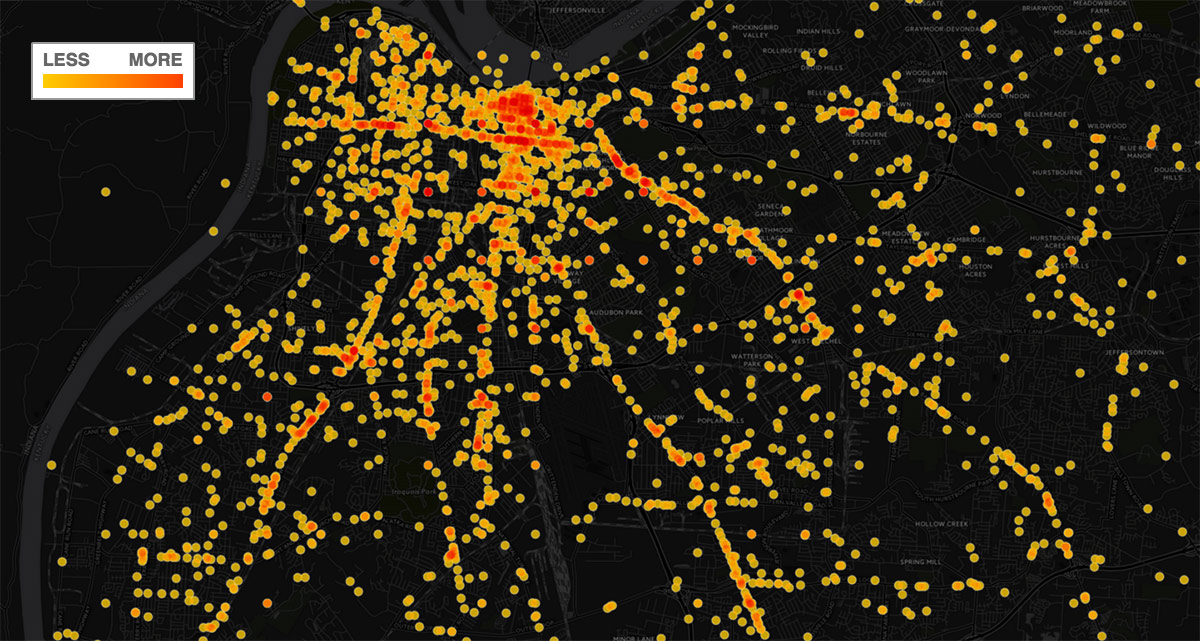
The Cities Safer By Design report suggests a number of design measures that can help Louisville achieve its safer street goals, beginning with redesigning out arterials, where most of the city’s deadly collisions already take place. Just take a look at the map below, and you’ll be able to make out most of Louisville’s major arterials by the trail of injured that have fallen along their lengths.
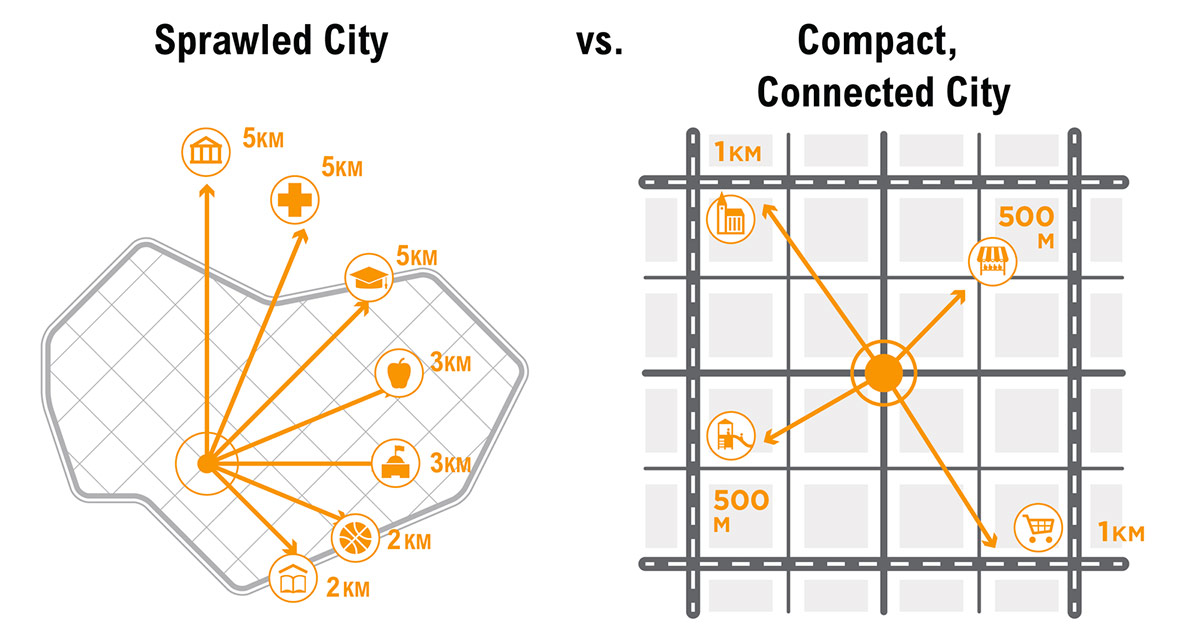
At the top of the WRI’s list of ways to increase safety on our streets is to shift from sprawling patterns of development—that rely on the car and generate more car trips—to a more compact pattern that considers walkability, cycling, and transit as a meaningful alternative to automobile use.
According to WRI:
Cities that are connected and compact are generally safer than cities that are spread out over a large area. Compact Stockholm and Tokyo have the lowest traffic fatality rates in the world—fewer than 1.5 deaths per 100,000 residents. Sprawling Atlanta, on the other hand, has a death rate six times that, at nine fatalities per 100,000 residents.

Louisville’s traffic fatalities vary by year, but on average in the past five years, 9.74 people per 100,000 residents dies each year on city streets (it’s higher if you look back 15 years, measuring in at 10.63 per 100,000).
The report details a number of ways to combat unsafe streets through design, including these five guiding principles: block size, connectivity, vehicle lane width, access to destinations, and population density.
Block size
According to WRI:
Longer block faces allow higher vehicle speeds, placing pedestrians at higher risk… Long blocks commonly have crosswalks only at intersections, indirectly encouraging unsafe midblock crossings. Long blocks also encourage higher vehicle speeds due to fewer junctions that interrupt travel. More junctions mean more places where cars must stop and pedestrians can cross.

The report recommends block sizes between 250 and 500 feet. Louisville’s standard Downtown block measures in at the high end of that spectrum, with various blocks ranging from 250 to 750 feet. There’s no rhyme or reason to block sizes in the suburbs.
When streets like suburban arterials are scaled to the automobile, the report recommends breaking up the long expanses with midblock crossings and passthroughs on 400–500 foot intervals, with signals, raised crossings, or speed humps.
Another alternative is to add new streets to reduce block lengths. WRI notes that T-shaped intersections are safer for pedestrians than four-arm (+ shaped) junctions.

Street connectivity
According to WRI:
Connectivity refers to the directness of links and the density of connections in a street network. A highly connected network has many short links, numerous intersections, and minimal dead ends. As connectivity increases, travel distances decrease and route options increase, allowing more direct travel between destinations and creating more accessibility (Victoria Transport Policy Institute 2012). It affects the need to travel and the attractiveness of walking and cycling.
The report suggests creating links for pedestrians and cyclists where existing roads are disconnected. “A dense network of streets can disperse traffic rather than concentrate it on arterials,” the report noted. “So that traffic is more spread out and can be scaled accordingly.” The report adds that increasing connectivity with emphasis on pleasant pathways by foot can reduce the overall number of car trips.
Street widths
According to WRI:

Street width often means the roadbed width, which is the distance between curb edges on opposite sides of a street, or, where no curbs exist, from pavement edge to pavement edge. The width of space allowed for vehicle travel on streets greatly influences pedestrian crossing distance and the roadway width potentially available for other uses, such as bike lanes, parking lanes, or landscape curb extensions. This is separate from the width of the space between buildings or the total public right of way, including sidewalks and other areas not dedicated to vehicles.
The report calls for reducing vehicle travel lane width to increase safety and to prioritize pedestrians. This shortens the pedestrian crossing distance, slows traffic naturally, and decreases severity of crashes. The report adds that street trees and on-street parking can help visually reduce the width of a street and slow traffic.
Access to destinations
According to WRI:
Pedestrian destinations or points of interest are normally places that people find useful or interesting or where employment, retail, and leisure uses concentrate. High-quality networks should be provided particularly between key destinations such as residential areas, schools, shopping areas, bus stops, stations, and places of work.
The report suggests looking holistically at neighborhood design, including access to transit, parks, schools, shopping, etc., with an appropriate walking distance to each. It notes that designing with appropriate densities and a mix of uses to support these functions may be required. Having many walkable destinations improves sociability as people use public spaces and reduce the number of trips by automobile.
Population density
According to WRI:
Population density refers to day and nighttime population per square kilometer or other unit area. Density is not directly related to safety, but can play a role in complementing other design factors. Locating more people within walking distance of services, public facilities, and transport can help reduce the need for driving.
The report notes that, compared to sprawling development, density reduces the amount of infrastructure required by the city, from roads to sewers to power lines. This, in turn, creates savings that can be used elsewhere in designing safer streets. Density also reduces the number of trips required by car.
“Density alone is not an indicator of traffic safety in cities,” the report explains, “but rather can be used with other community design elements in this guide to increase walking and cycling and reduce motorized travel. Dense communities should be coupled with safe street designs that protect pedestrians and cyclists.”
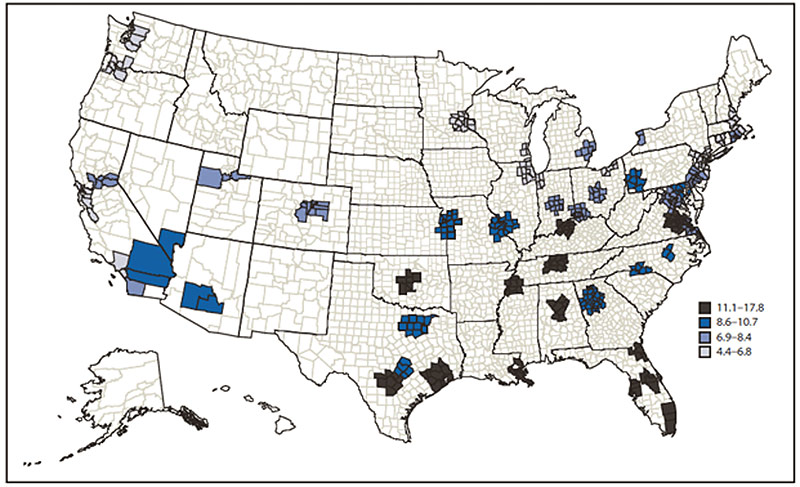
In 2012, the Centers for Disease Control and Prevention (CDC) also listed Louisville near the bottom of metros in the United States for traffic safety. Their report indicated Louisville’s metropolitan statistical area had a fatality rate of 11.8 per 100,000 residents. For people aged 15–24, that rate jumped to 14.8 per 100,000. Those numbers put the city well over the 50-city average fatality rate of 8.2 per 100,000 and above the national average of 11.1. The CDC study found that cities in the southeastern U.S. fared the worst for street safety.
Both the WRI and CDC reports show that Louisville must get serious about designing better arterial streets that serve all residents of the city. The current pattern of building superhighways has not reduced congestion and has only served to increase the danger on our streets for all users.
[Top image: Vanderbilt Avenue in Brooklyn’s Prospect Heights neighborhood includes a number of design elements that prioritize pedestrians, cyclists, and transit users. Courtesy New York City Department of Transportation.]


You cannot keep approving Walmarts set back 150′ from an intersection and expect LALA efforts to be effective ! Louisville no longer knows nor respects planning and design. It’s crackerjack planners now all plan for other better cities. And those with a voice are slapped down by the development sheriffs who really run things – so we sprawl on and make very bad choices for new projects that continue to reject even the most historic walkable intersections. Witnesseth Kindred. Look at the fight to make Dixie walkable and safe! Reject solar lighting but keep creating silly efforts like LAL. We’re the Rowan County of good planning.
Lol
Once again I find this entire website to be extremely one-sided and site information that proves their point. Funny how the statistics for Los Angeles weren’t mentioned positively since they are much more car centric than even Louisville is in their statistics are lower than ours. One of the biggest reasons is that they spend much more time per day stuck in traffic and polluting the environment with their automobiles than we do here in Louisville. At least in Louisville traffic moves reasonably well in most cases instead of crawling. Quite possibly the problem lies in the complete disregard for traffic that pedestrians and bicyclists have in Louisville instead of the drivers or does the author and this website totally throw out that side of the argument? Maybe it’s the fact that in Louisville the pedestrians and bicyclists have a greater sense of entitlement because of websites like this and others that say they are always right?
As an Angeleno I feel compelled to shed some light on why Los Angeles’ traffic fatality stats would be well above New York & Boston, but also much lower than Louisville, Nashville, and OK City. First, it is important to note that this is all traffic accident fatalities, not just pedestrian.
So… It is true that there is a lot of sprawl in LA and that Angelenos spend a lot of time in their cars. So that would tend to push the stat up. It’s probably also true that Angelenos spend a greater percentage of their driving time in heavy traffic (pushing the stat down via slower speeds), but they also spend an overall greater amount of time driving without gridlock (pushing the stat back up via greater speed). Angelenos, because they are on average far more skilled drivers than Louisvillians, drive much faster in clear conditions than many other parts of the country. In fact, Angelenos will merrily zip along at 65+ MPH in freeway conditions that would cause gridlock in Louisville. You might expect that to cause the stat to go up since any crash might be worse. But countervailing that is the fact that LA drivers are far more skilled, so they don’t crash as often or as badly. Next, for the most part, roads in LA are better designed than in Louisville. And the connectivity between streets is way, way, better. Those things may push the stat down. Except it also means that it’s much easier to get places in LA (with greater speeds) than the popular depiction would lead you to believe (as long as you aren’t going 20-30 miles and passing through a mountain pass or near downtown). Finally, for the car side of things, LA is actually the 2nd most densely populated city in the country, so despite the sprawl, in many areas there are lots of people on the streets and cars on the roads. This may depress the fatality stat.
On to the walkers and bikes. Here, Louisville does not compare well. In LA, my experience is that most bicyclists use the parking lane most of the time. There’s no self-righteous road hogging. And cyclists cross streets near the crosswalk, and make left turns by making two street crossings with the lights. It’s the only sensible way to do it, and is precisely the intent of the innovative street designs shown in other posts here. Finally, LA does not have a culture of jaywalking, making it much less likely for pedestrians to go splat.
The upshot is that for all its sprawl and car dependence the reason that LA’s traffic fatality stats are not nearly as high as Louisville, Nashville, and OK City is because a) it actually has many of the attributes mentioned in the article, b) drivers are far more skilled, and c) non-auto users of roads behave better.
Whenever i visit my hometown I always find driving there, even with the traffic, to be a breath of fresh air and an enjoyable experience. Play ball!
It seems like compared to other parts of the country, the traffic really isn’t that much cause for concern. This article is skewed and missing important data. I also think that due to entitlement mentality (like, in conjunction with this article), people on bicycles and pedestrians think that they own the road and therefore don’t take the proper safety precautions. http://www.tjwillmakeempay.com/Car-Accidents/Bicycle-Accidents.shtml
I drive in & out E Broadway five days a week. Every single day I see numerous pedestrians crossing mid-block, pausing in the middle turn lane to await a clearing in traffic. Sometimes pedestrians jaywalk less than 20 feet from a designated crosswalk with a functioning crosswalk signal. Sometimes pedestrians jaywalk while holding infants or pushing toddlers in strollers. So, what should be done to promote pedestrian safety on E Broadway? Stripe crosswalks midblock? String up traffic signals midblock? Reduce the speed limit from 35 to 25 so pedestrians can jaywalk more safely? Force motorists on bicycles? How about if pedestrians cross at the crosswalk! What about fencing some blocks like what U of L has done to guide pedestrians to crosswalks? .How about taking responsibility for limited insight and poor judgement and not blaming motorists
Jeff, I completely agree. I live in Paristown Pointe and take Broadway east going home every day from work. Every single day there are folks who wonder in the middle of traffic on Broadway without a care in the world.
Comments are closed.