Data Visualization
Mapping non-local property ownership in Lexington
In some of our earlier work last year, we examined the effects of absentee property and housing ownership in Lexington in relation to the...
There’s a major geographic disparity in Louisville home values between 2004...
The Washington Post has created a map that shows how home values changed, by Zip Code, from 2004 to 2015. Based on data from Black...
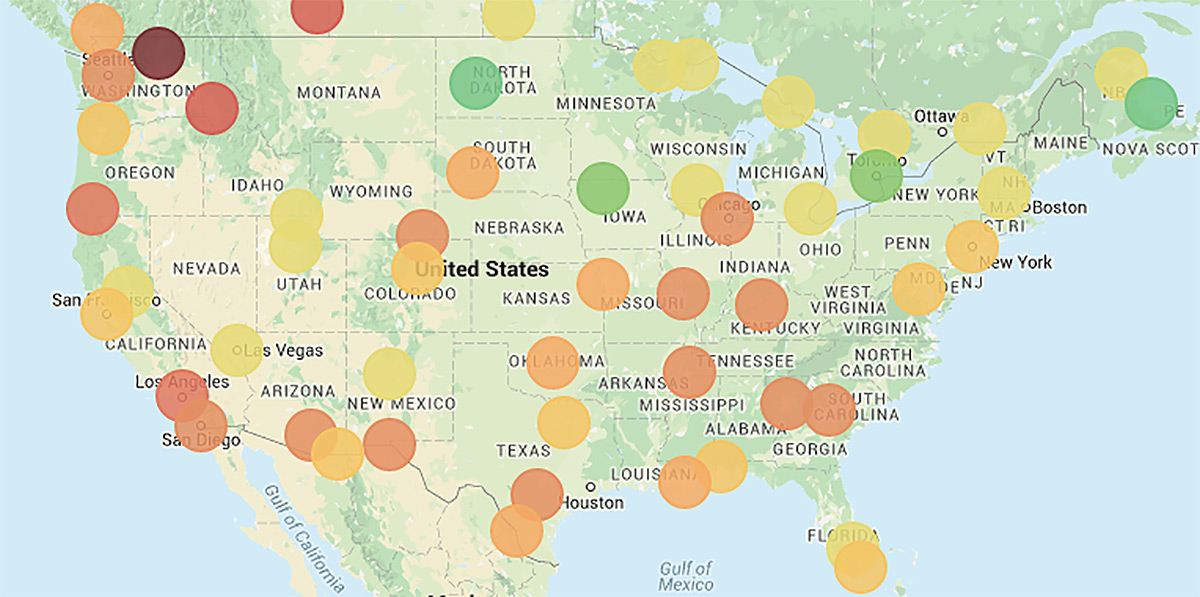
This new map compares breathing bad air to smoking cigarettes
Most people who don’t smoke have a visceral reaction to the smell. I was in Maysville last fall and went into a restaurant where...
Seeing is believing: “Air Bare” installation merges pollution data and art...
There's something in the air in Louisville. The city's air pollution regularly ranks among the nation's worst, but a new data visualization project by...


