
(Editor’s Note: Pat Smith tracks data about cities in order to tell stories about their urbanism. Here, he looks at the latest census data from 2010 that counts residents living in and around Downtown Louisville. This post first appeared on Pat’s blog, City Researcher, in January 2013, but this is still the latest Census data we have on Downtown residents and it still teaches some very important lessons. It appears here with permission.)
According to the city, Louisville’s downtown population increased 30 percent since 2000, to 4,564 people in 2013.
I’ve been looking at a lot of data for Downtown Louisville. In part, I was interested in being a more informed citizen as the Louisville Downtown Development Corporation got started on a new ten-year Downtown Master Plan a couple years ago. While so many people are thinking about Downtown, and as people put forth their thoughts and ideas on how to improve the city, the inevitable chicken vs. egg debate is sure to emerge at some point: does retail and commercial draw residents, or do residential rooftops need to be in place before such businesses can thrive?
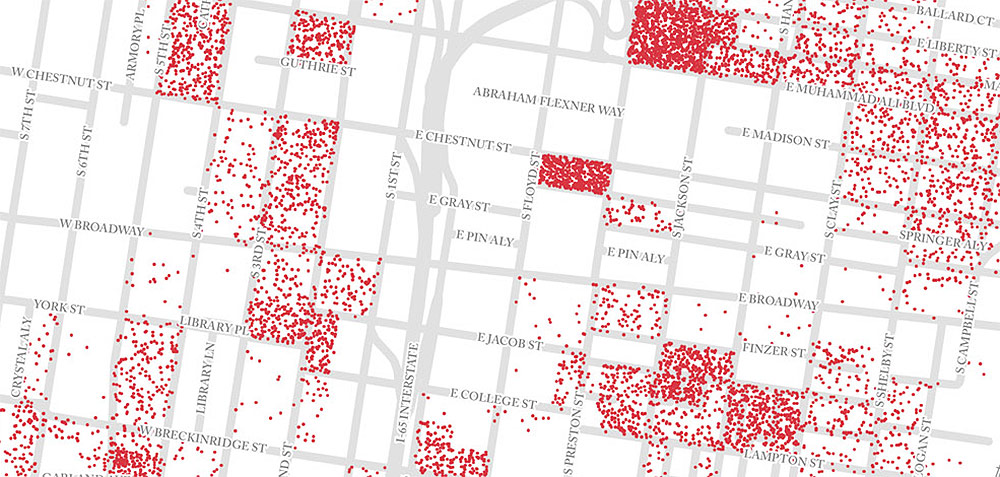
Obviously that argument can, and does, go both ways in many cities across the United States, but in my humble opinion (and based on the map below) I think Downtown Louisville badly needs a hearty injection of new residents in the Downtown core (and much needed new multi-unit housing development to make that possible). There are huge gaps in residential buildings across Downtown, and most of the only truly dense Census Blocks from 2010 are public housing towers and corrections centers.

I haven’t made a Dot Density Map since my days as a geography student, but I thought it made for a good visualization tool for seeing the large, uninhabited swaths of Downtown Louisville. I was inspired by Brandon M-Anderson’s AMAZING Dot Density web map for the 2010 US and Canadian populations. The population data came from the Census 2010 TIGER files, and everything else from the amazing folks at KYGEONET, who maintain Kentucky’s best free and open geodata portal.
[Editor’s Note: We made the map into a gif showing an aerial view of downtown so you can see what is located on blocks with higher densities. An interesting observation: the densest concentration, noted by the solid block on the upper-left corner, is Louisville’s jail.]


The dense location on Chestnut is the other jail:
Community Correctional Center
316 E. Chestnut Street
Wow. I wasn’t aware there were so many people living in the District Court building. Glitch?
You can also see the dense cluster at Hotel Louisville (Wayside). I’m not surprised, as a Downtown resident, at the map as it agrees with my general mental map. Most of the worst empty patches corresponds with the worst “parking lot districts”, too.
There’s a lot more people living north of Market and east of the 65 than indicated, as well as a missing apartment/condo complex on Main too.
Comments are closed.