

(Editor’s Note: Portland, Oregon–based City Observatory has been keeping tabs on Louisville’s tolling system since it launched. This is the latest in a series by Joe Cortright. For more, view previous installments: “For whom the bridge tolls,” 12/28/2016; “Has Louisville figured out how to eliminate traffic congestion?,” 1/18/2017; “Louisville’s experiment in transportation economics,” 1/19/2017; “Postcard from Louisville: Tolls Trump Traffic,” 2/15/2017.)
![]()
Time for one of our periodic check-ins on our real world transportation pricing experiment in Louisville, Kentucky. As you recall, we’ve been watching Louisville closely, because just at the end of last year, the city started what amounts to a laboratory experiment in transportation behavior. Kentucky and Indiana built a new bridge to double the capacity of the Interstate 65 freeway as it crosses the Ohio River near Downtown Louisville. At the same time, it put tolls on the I-65 crossing, but not on the nearby Second Street Bridge, an older, four-lane highway bridge that connects Louisville to the Indiana suburbs north of the River.
As we reported in February, the initial month’s worth of data on bridge traffic shows that adding tolls (which run from $1 to $4 for cars) have caused traffic levels to fall by almost half, from about 122,000 vehicles per day to about 66,000. We showed photographs from area traffic-cams that show rush hour traffic on the tolled bridges almost empty, while traffic was fairly thick on the free Second Street Bridge.

The latest phase of our experiment came recently, courtesy of “Thunder Over Louisville,” a kind of combined concert, airshow, and fireworks display that is held annually. To handle the big crowds that come Downtown, and afford great vantage points, the city closes the Second Street Bridge. It did so on the Thursday before Thunder. So we looked to see how this affected traffic levels. (The festival itself didn’t start until Friday night, so Thursday was still a reasonably typical business day.)
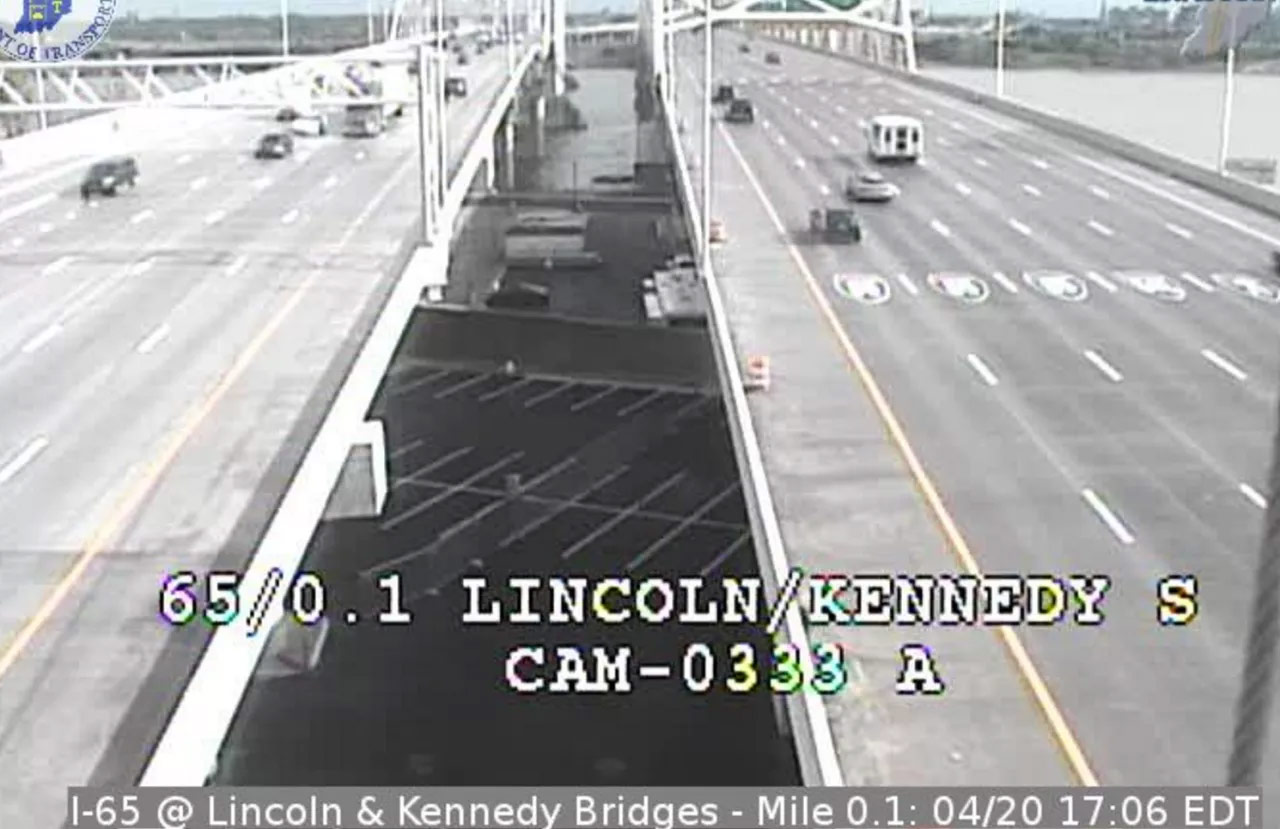
As you can see, traffic on the tolled I-65 bridges was still very light. (The photo below was taken about five minutes after 5:00p.m. on April 20 and comes from the local “TRIMARC” traffic monitoring website.) The peak direction of traffic is moving away from the camera’s vantage point, on the right hand side of the photo, northbound, from Downtown Louisville.
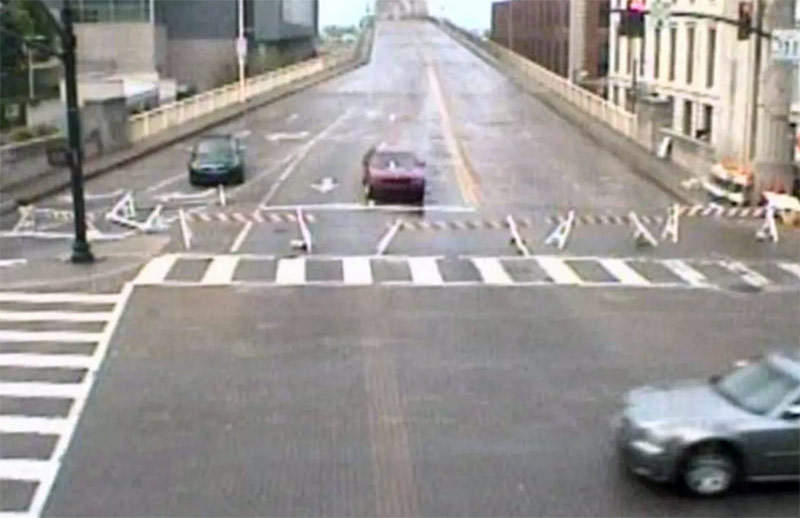
As noted, the Second Street Bridge was closed with barricades. This is the bridgehead in Downtown Louisville.
What these images suggest is that, even with the nearby free alternative closed, there’s way, way more capacity on I-65 than there is peak hour demand for travel. You can compare these photos to ones we captured two months ago (below) when the Second Street Bridge was open to traffic at rush hour. While ostensibly the crossing was widened from 6 lanes to 12 to eliminate congestion, the real congestion-fighting investment was the decision to ask users to pay just a portion of the cost of widening the road. With tolls in place, drivers have voted with their feet (or perhaps, wheels) that they didn’t really need additional capacity.
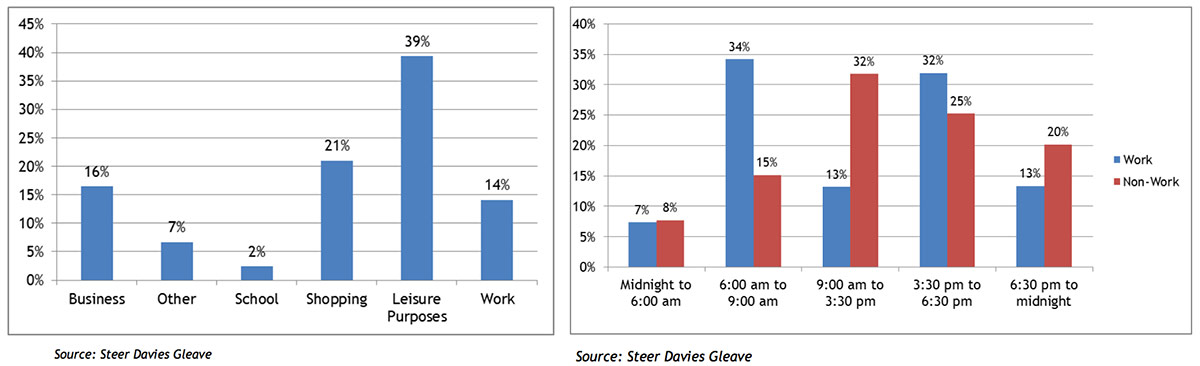
(Editor’s Note: As part of a 2013 traffic and revenue study by the Ohio River Bridges Project, potential bridge users were asked of their habits and behaviors in crossing the river. As the above charts demonstrate, there’s a lot of flexibility in the trips being made. For instance, a leisure or shopping trip could be facilitated on another bridge or demand for such activities could be evaporated completely.)
There’s another point as well. It isn’t just that traffic has shifted to the “free” alternative. It’s that with tolling in place, apparently many other trips just simply evaporated. That tendency of traffic to disappear when there’s a toll is an indication that people have much more flexibility about when, where, and how much they travel than is usually contemplated in policy discussions or travel demand models. The mental model that says traffic levels are some inexorable natural force like the tides, which must be accommodated or else, is just wrong.
Of course, photos of one moment in time (even at the height of what should be rush hour) are hardly the best evidence of how well a bridge is being used. For that, we need actual traffic counts–the kind of data that would be generated, for example, if you had cameras, and license plate readers and transponder readers on a bridge, which is exactly what we have on I-65.
But while Riverlink, the toll-bridge operator quickly posted January’s weekly traffic counts on February 1, its website has no new traffic data for the intervening two-and-a-half months. In fact, the Riverlink website which featured more or less weekly press releases since November, contains no new press releases since that February 1 traffic data report.
(Editor’s Note: The day this article was originally published on City Observatory, Riverlink released its first quarter traffic counts. We’ve charted them below. While traffic typically peaks during the late summer months of July and August, there’s still a sizeable gap to be filled between actual counts and the state’s projection.)

There are many reasons why they might not yet have pulled together the data, and we’ll be watching eagerly to see when it becomes available. But we couldn’t help but notice a story that appeared in local press this month. It turns out that the Kentucky Transportation Cabinet has just signed a $300,000 contract with a Florida consulting firm to help it “determine whether the toll revenue generated by the RiverLink bridges is enough to make debt payments on the project’s bonds.” The financing of the widened I-65 crossing (and another beltway freeway crossing several miles to the East) hinges on tolls generating enough revenue to repay the bonds that Kentucky issued to pay for the project. If toll revenues don’t grow fast enough in the years ahead, the state will have to find some other source of funds to make these payments, which could make this particular experiment in transportation behavior a particularly expensive one. Stay tuned!
(Editor’s Note: This article has been cross-posted from City Observatory. It appears here with permission. Traffic images courtesy TRIMARC.)


It might help credibility if the author recognized that the Kennedy (right bridge in each of the I-65 images) is the *southbound* bridge, and the Lincoln (left in each image) is the *northbound* bridge. The differences in the superstructures are readily apparent.
It might also help credibility if the author would factor in the effect of the east end bridge. Anecdotal reports indicate that traffic along I-65 between the Snyder (I-265) and downtown have dropped sharply since the east end bridge opened, which would (obviously) affect traffic counts on the I-65 bridge in the downtown Louisville area.
so we needed the east end bridge only. A five year old could tell us that Tom.
Good points, Tom. The author also should have considered the Sherman Minton bridge. It would be interesting to know how its use has changed. I for one have used it more in the past five months than I had in the past five years.
Isn’t it pretty much a fact that the two bridges weren’t constructed because the data and projections demanded them but rather because of a terrible political compromise? Sad to see reality is bearing that out while we all pay the cost.
I would like to see a study on the effect (positive or negative) that the tolling has had on the Louisville area regional economy. I suspect it has been a drain, but I would like to see facts.
Comments are closed.