Data
There’s a major geographic disparity in Louisville home values between 2004...
The Washington Post has created a map that shows how home values changed, by Zip Code, from 2004 to 2015. Based on data from Black...
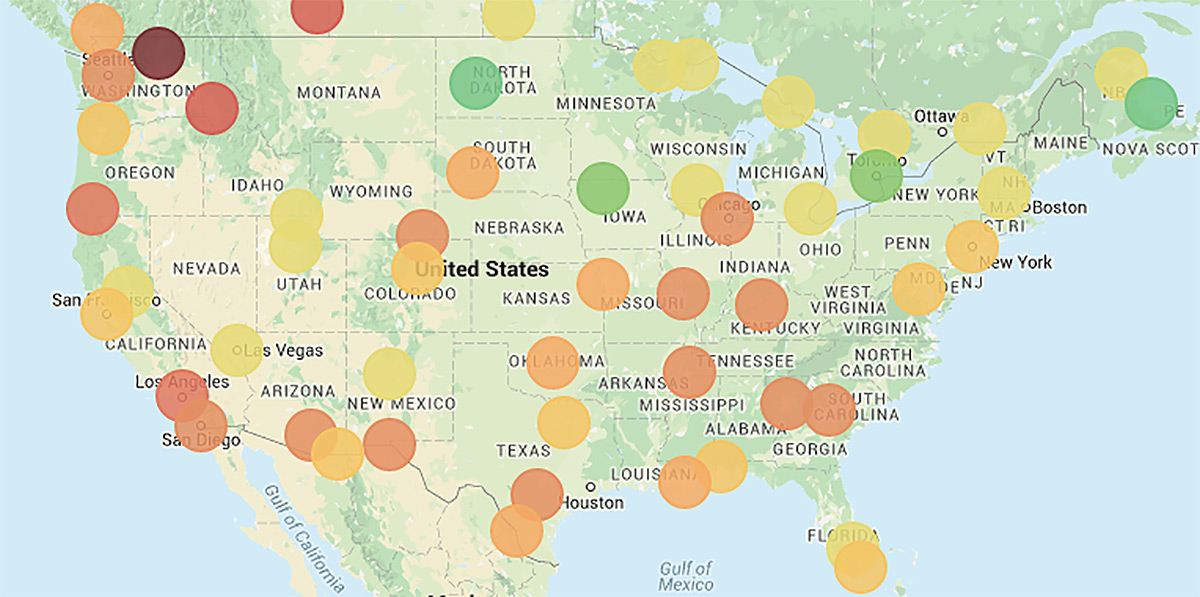
This new map compares breathing bad air to smoking cigarettes
Most people who don’t smoke have a visceral reaction to the smell. I was in Maysville last fall and went into a restaurant where...
To be seen by a city: Biking toward an ethos of...
I am a high school geography teacher. I work with students at a private school in Louisville, Kentucky. I experience something like a city...
Seeing is believing: “Air Bare” installation merges pollution data and art...
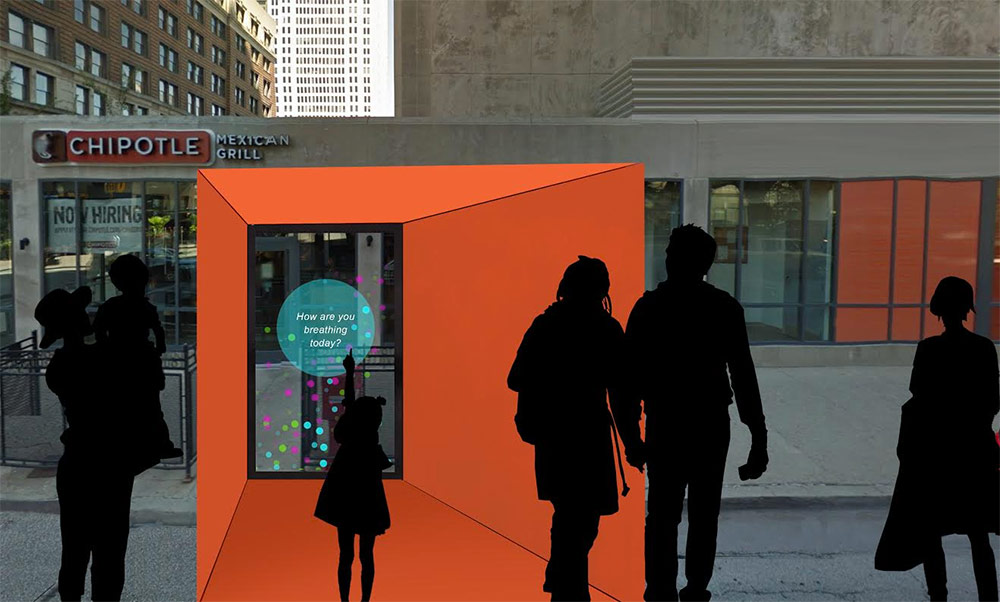
There's something in the air in Louisville. The city's air pollution regularly ranks among the nation's worst, but a new data visualization project by...
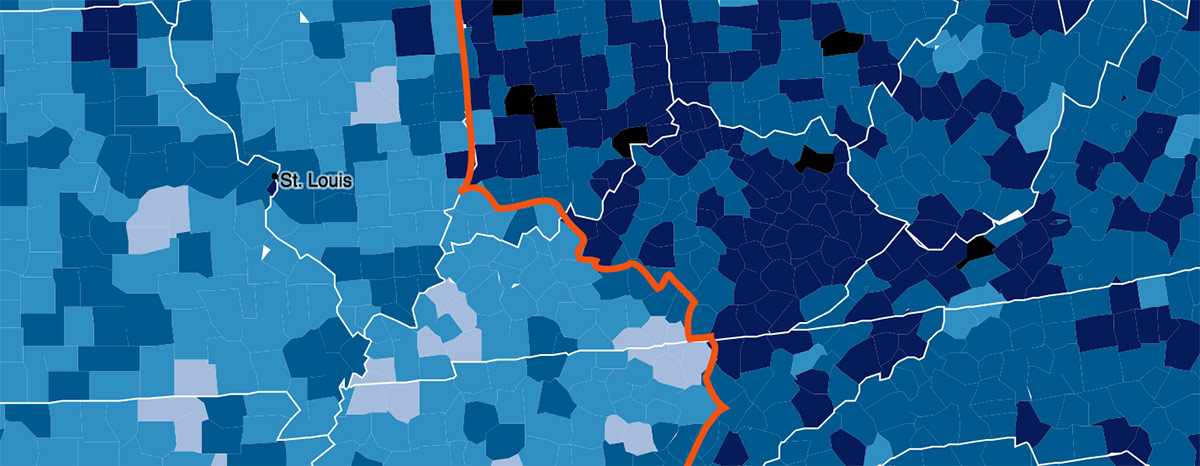
Kentucky shows just how meaningless time zones are to sleeping habits
Where I live in Brooklyn, the sun will set today at the depressingly early time of 4:45p.m. In Louisville, the sun sets tonight at...
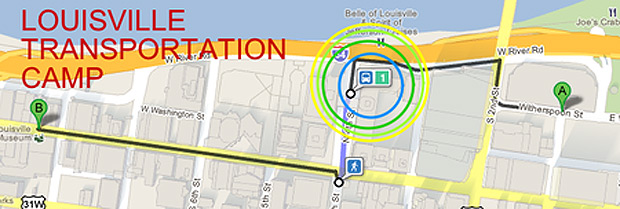
Q+A with Michael Schnuerle & the Louisville Transportation Camp
In the information age, data is king, and how we use the data all around us, from tracking transit schedules to monitoring traffic delays,...
Korean Pavilion Shows Real-Time Air Quality Information
This pavilion in Seoul, Korea displays dynamic information about air quality in the city and responds to user input via social media. I first...
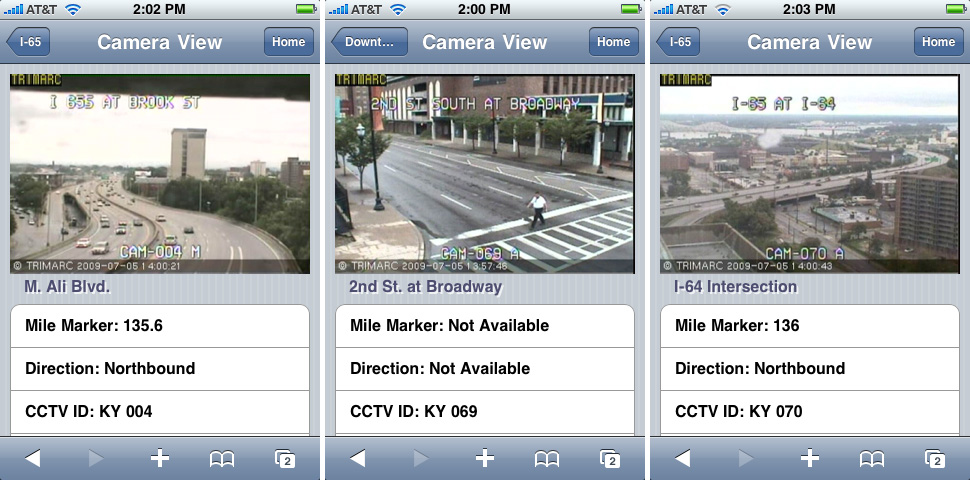
New iPhone App Makes Traffic Data Mobile
A little while back, a tipster wrote in to point out a new iPhone app created just for Louisville transportation. Kyle Melwing has created his...


