The Level of Service metric shaped the American built environment, but that might soon change

1

“What you measure is what you get,” the saying goes.

That’s certainly true for transportation policy. And for a very long time one metric has reigned supreme on American streets: “Level of Service,” a system that assigns letter grades based on motorist delay. Roughly speaking, a street with free-flowing traffic gets an A while one where cars back up gets an F.

Level of Service, or LOS, is what traffic engineers cite when they shut down the possibility of transitways or bike lanes. It also leads to policy decisions like road widenings and parking mandates. Even environmental laws are structured around the idea that traffic flow is paramount, so they end up perpetuating highways, parking, and sprawl. Because if the top priority is to move cars—and not, say, to improve public safety or economic well-being—the result is a transportation system that will move a lot of cars while failing at almost everything else.
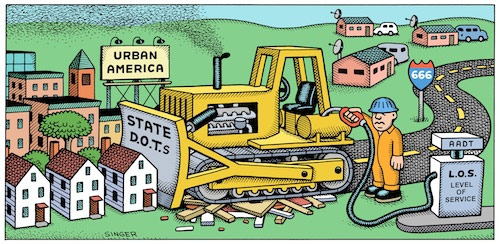
The old way of making transportation decisions prioritized the movement of cars above all. The Federal Highway Administration will encourage local agencies to shift to other methods. (Cartoon by Andy Singer via Project for Public Spaces)

The good news is that there’s a growing recognition inside some of the nation’s largest transportation agencies that relying on LOS causes a lot of problems.

Just last week, the state of California introduced a new metric to replace LOS in its environmental laws. Instead of assessing how a building or road project will affect traffic delay, California will measure how much traffic it generates, period. Car trips, not car delays, will be the thing to avoid. This is likely to have the opposite effect of LOS, leading to more efficient use of land and transportation infrastructure.

Change is afoot at the federal level too. Officials at the Federal Highway Administration (FHWA) are looking at how they can spur changes like California’s LOS reform in other places.

Barbara McCann of the Policy Office of the Secretary for Transportation at U.S. DOT. (Courtesy Barbara McCann)

Barbara McCann, of the Policy Office of the Secretary at U.S. DOT, told Streetsblog that her agency has been charged with reviewing internal policies that are an obstacle to better biking and walking. “LOS is something that has come up with that,” she said.

Despite what you may have been told, “there is no federal mandate for Level of Service,” she said. The federal government has never compelled state and local governments to emphasize LOS above all. But Level of Service is a deeply ingrained engineering convention. Transportation planners might not be attuned to the value judgments inherent to LOS, or to its flaws.

What FHWA can do is accelerate the adoption of alternatives to LOS. Over the next year or so, McCann says, the agency plans to actively encourage state and local policy makers to consider different performance measures.

As a first step, FHWA will soon release a case study about a local agency that is moving away from using LOS. Then the agency will develop a peer-to-peer exchange, where cities and states can share ideas and experience about shifting to other metrics.

Finally, as required by the 2012 federal transportation bill, MAP-21, FHWA is working on a whole new set of performance measures for American transportation agencies. The law specifies, for the first time, that states DOTs should track how they perform in terms of safety and environmental protection. The law requires state agencies to set goals and report progress toward meeting them.

One of the big unknowns is how the federal performance measures will define “congestion,” which is one of the metrics state DOTs will have to assess. The law does not specify that congestion must be assessed using LOS, but federal regulators could decide to do that—and if they do, not much will change. A much better option would be to use a metric closer to what California is doing—traffic generation, not driving delay.

The rule-making period is currently in progress, and McCann said she can’t discuss details during that time.

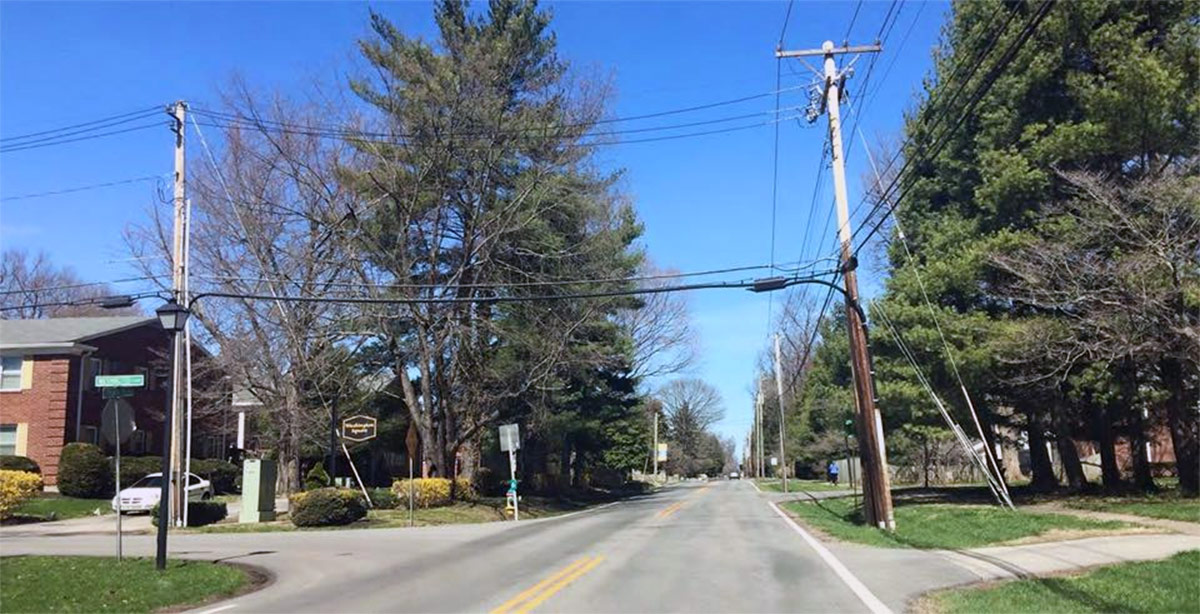
[Editor’s Note: This article was cross-posted from Streetsblog USA. Top image shows Shelbyville Road, which was designed to provide a high Level of Service for motorists (Branden Klayko / Broken Sidewalk).]

Brewery will bring historic brand back to this historic Bardstown Road building

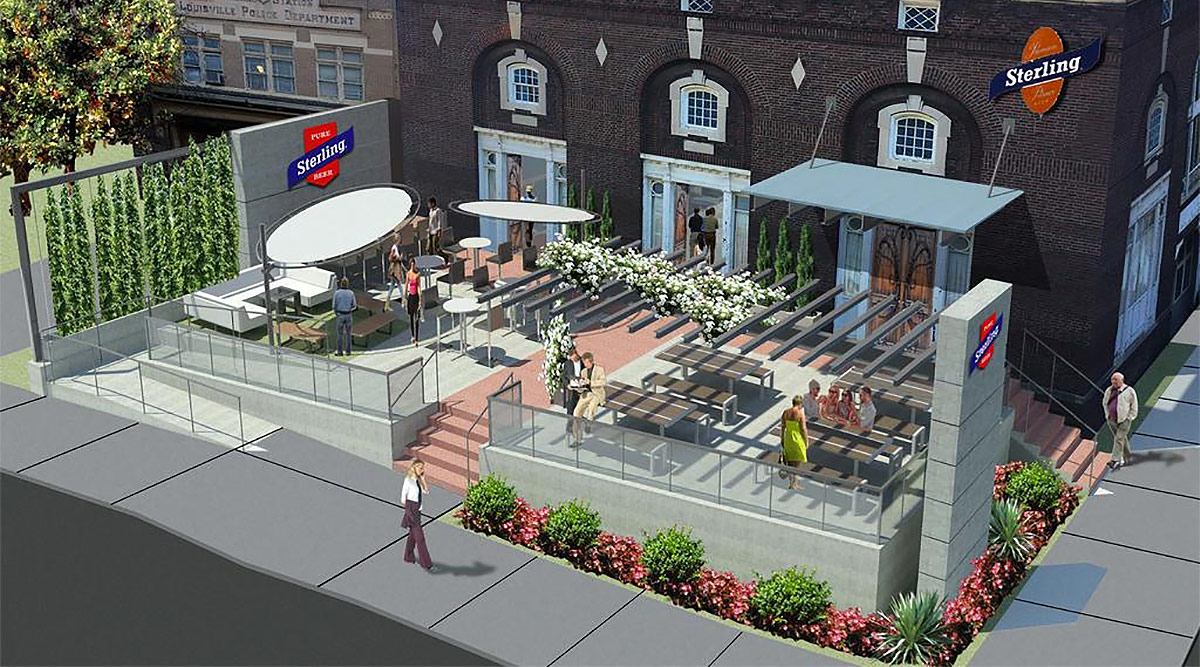
Speculation is over about what will fill one of Bardstown Road‘s most beautiful, and historically underutilized, buildings. Metro Louisville announced today that Louisville Sterling will purchase two surplus city-owned buildings at 1300–1306 Bardstown Road for a craft beer operation with a retail component.

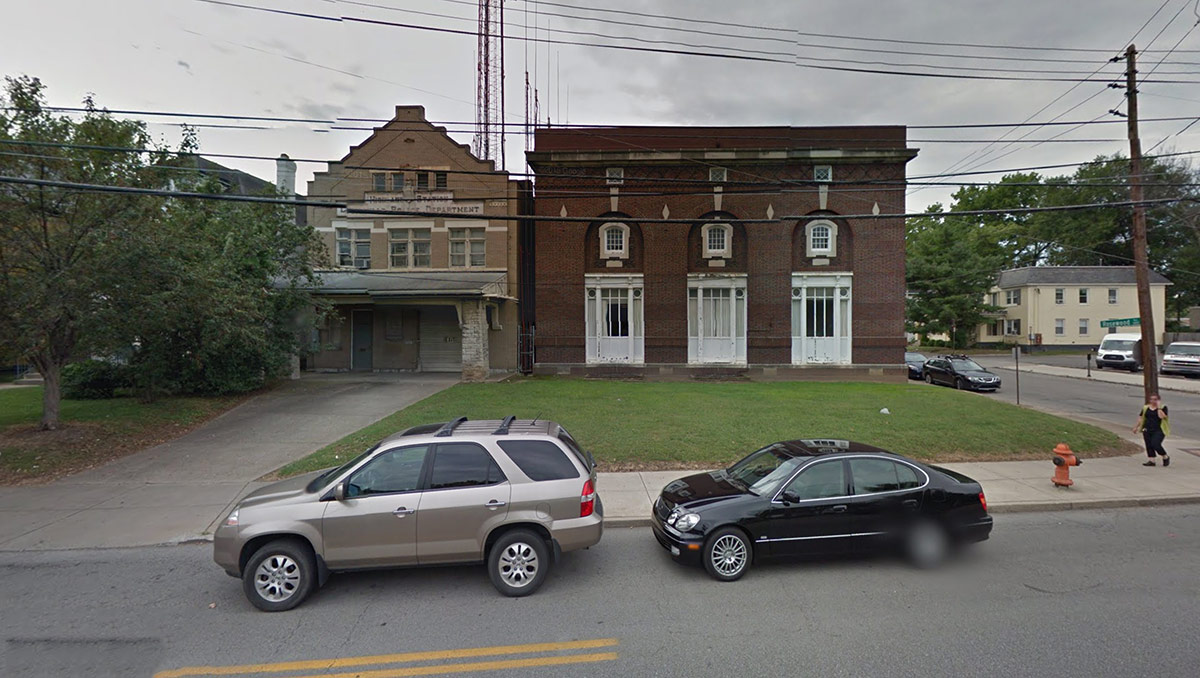
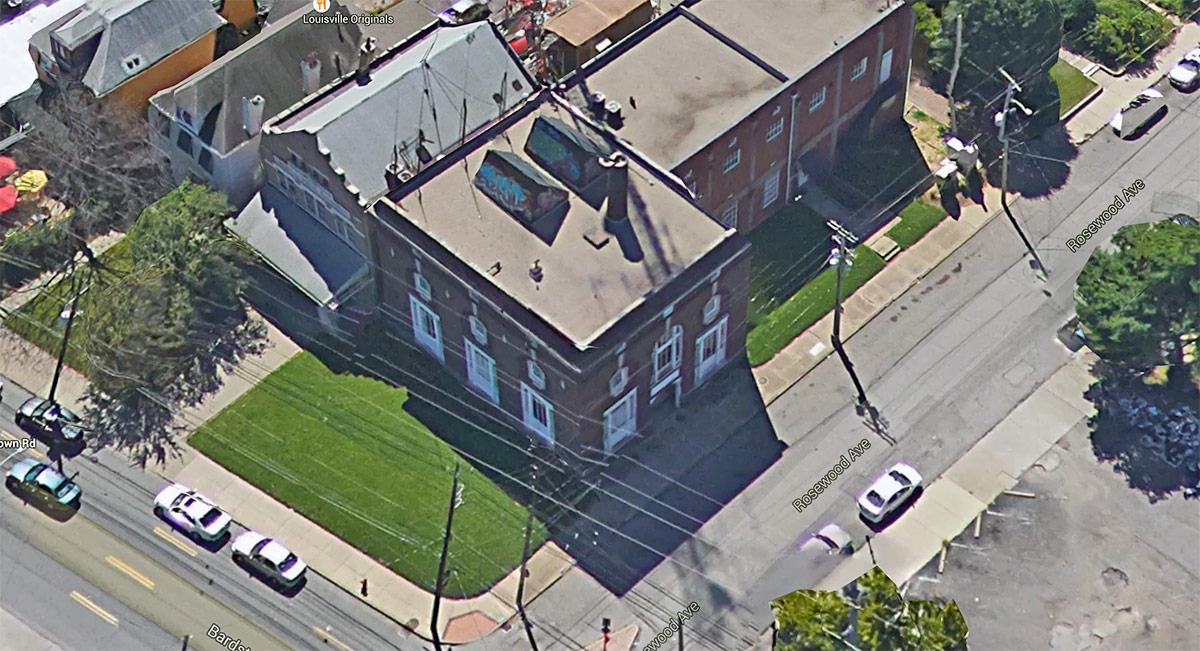
As we previously reported, those two structures, on the corner of Bardstown and Rosewood Avenue on the Tyler Park side of the street, have been vacant since November 2012 when a consolidation of MetroSafe, the city’s emergency response system, made the buildings unneeded for city use. They were declared surplus by Metro Council last November.

The two buildings at 1300–1306 Bardstown Road. (Courtesy Google)

Louisville Sterling, operated by brothers Todd and Ken Jackson, owns the Sterling beer brand, which it acquired in 2012, the city said in a press release. The historic Louisville brand dating to 1863 has changed hands multiple times over the years and had moved to Evansville and later Pittsburgh. Today it’s brewed in Stevens Point, Wisconsin.

“Louisville Sterling’s goal is to restore the historical structures for the purpose of establishing a craft house and tasting room and to move local production back to Sterling’s original home of Louisville,” the press release read.

According to the city, the Sterling brand has been nicknamed the “Beer of the South.”

Concept rendering of what a taphouse on Bardstown Road could look like. (Tucker Booker Donhoff + Partners)

The company will restore both early 20th-century buildings for the craft house and tasting room. The site will also include a gathering house and events space, offices, and a small brewing operation. Combined, both buildings cover about 15,000 square feet.

According to a report by Marty Finley at Business First, Louisville-based architecture firm Tucker Booker Donhoff + Partners has designed an architectural concept plan, seen above, of what the property could look like.

(Branden Klayko / Broken Sidewalk)

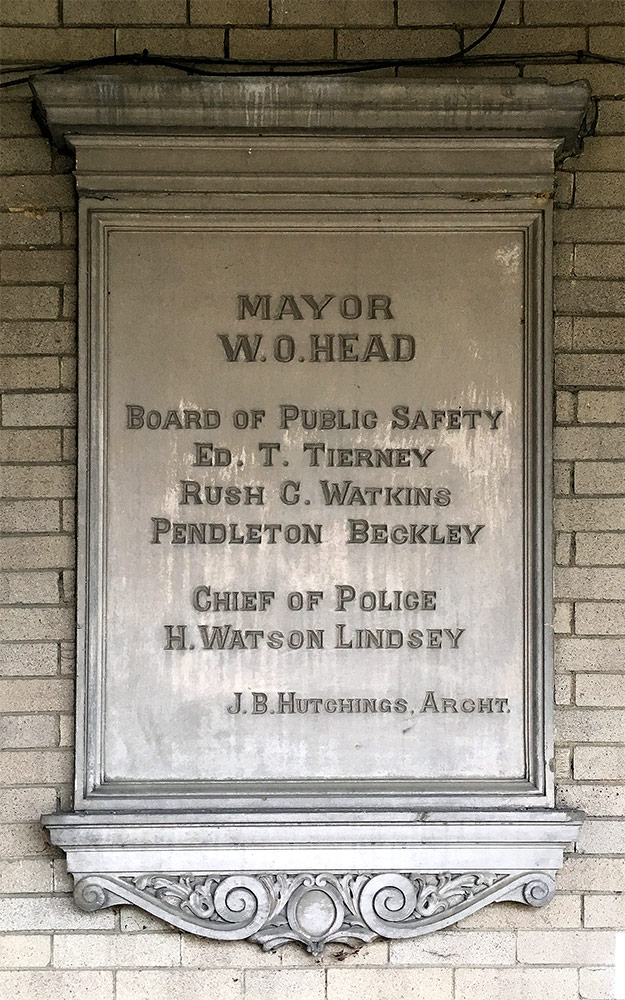
The southernmost building at 1306 Bardstown was purpose-built as a police station by architect J.B. Hutchings and continued to serve as such until just a few years ago.

Next door, 1300 Bardstown was built as a telephone switching building in 1917 and later served as the home for the Louisville Ballet. The city purchased 1300 Bardstown in 1995 from the Ballet for $235,000. Despite the outward appearance that there could be a grand ballroom inside, the structure hides a more generic layout befitting of its original use. The building is sturdy, however, built of reinforced concrete.


(Courtesy Google)
(Courtesy Google)

When we wrote that the buildings were declared surplus last year, a tipster informed us that a deal was already in the works. In early December 2015, Rebecca Fleischaker, deputy director of Louisville Forward, Metro Louisville’s department of economic development, told Broken Sidewalk in an email that “a sale is lined up, but is still being worked out.” She declined to give specifics about the pending deal, adding that the city would “not be putting the buildings out to bid or taking offers.”

“The property has been available, and has been shown, for about 3 years,” Fleischaker said. That marketing began once MetroSafe moved out. “This building was then marketed for redevelopment through Public Works and then Economic Development Departments, as well as being listed on the city website and Opportunity Space, a website that lists all city-owned properties available for sale,” she added.

Over that three-year span, a number of interested parties emerged. “We have talked with many business owners and individuals about the two buildings, but nobody had the finances to restore and fit out the building,” Fleischaker said. “Recently, however, we’ve been working with a group who was very interested, has the financing and was interested in moving forward in bringing jobs and investment to the area.”

(Branden Klayko / Broken Sidewalk)

As part of the deal, Louisville Sterling has agreed to perform environmental assessments at the two properties to determine how much cleanup might be necessary in redeveloping them. The city said the final purchase price would reflect a fair market value taking that cleanup into consideration. “Louisville Metro did have an appraisal of these properties done in anticipation of entering into a market-rate sale,” Fleischaker told Broken Sidewalk.

If all goes according to plan, construction could begin by fall 2016. The Sterling facility joins another major beer bar, HopCat Louisville, currently under construction just up the street.

Church dating to 1842 to see new life with mixed-use conversion on Clay Street

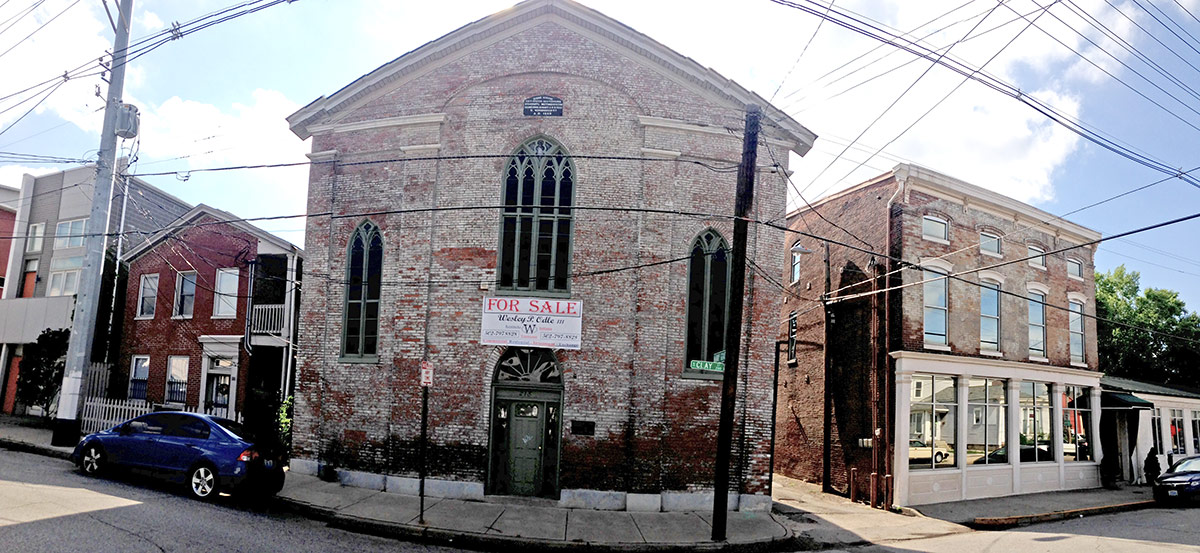
When I first wrote about this church in October 2008, its fortunes didn’t look all that good. Its buttresses had been hit repeatedly by motorists driving down the alley and bricks were crumbling away. The building’s peeling grey paint exposed a building in need of some serious repair and the structure’s owner, the Kraemer Paper Company, wasn’t interested in selling as Nulu began to blossom all around it.

(Branden Klayko / Broken Sidewalk)

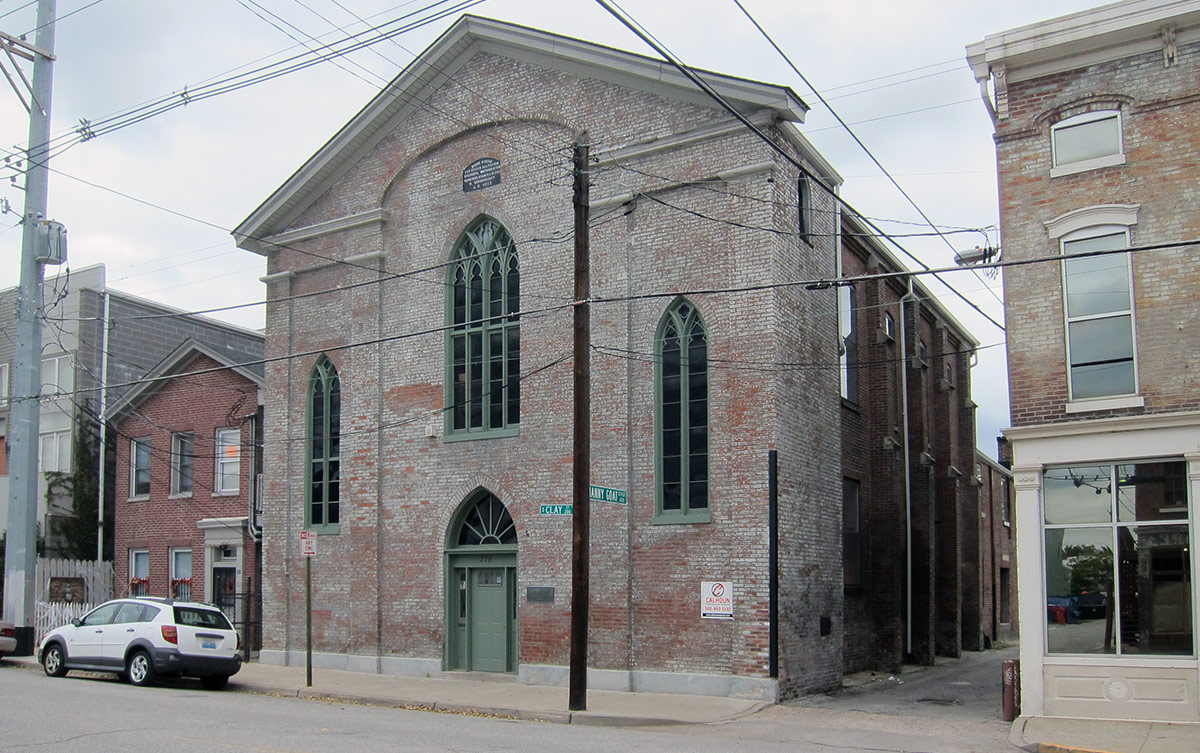
Kraemer Paper used the structure at 218 South Clay Street as a warehouse for toilet paper and other janitorial supplies, masking the nearly 160-year-old structure’s proud history.

It’s exciting today that the old church’s fortunes are looking up and renovations are planned for the property that will add to the vibrancy of the expanding Nulu neighborhood.

(Branden Klayko / Broken Sidewalk)

WDRB’s Chris Otts reported Wednesday that the building, located on Clay Street between East Market Street and Jefferson Street, has been sold to husband-and-wife team Creighton Mershon and Jessica Arrington, New York City–based graphic designers. The couple plans to redo the church as a mixed-use structure with commercial space and residences.

Mershon and Arrington purchased the structure from investors Bill and Mary Lou Marzian who had snagged the structure a couple years before and made some needed repairs (they purchased the church in 2012 for $300,000).

(Branden Klayko / Broken Sidewalk)

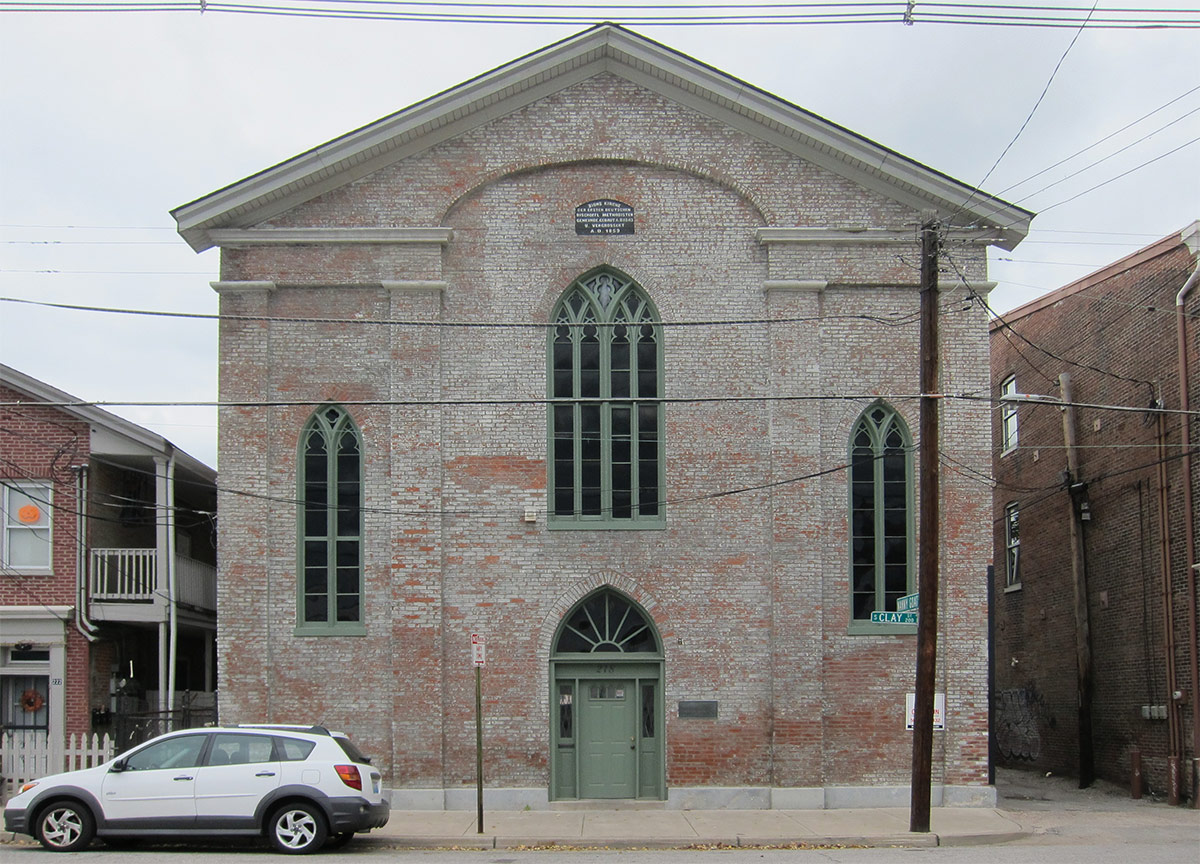
An inscription atop the church on reads in German, “Zions Kirche, Der Ersten Deutschen Bischoffl Methodisten Gemeinde. Gebaut 1843, U. Vergrossert, A.D. 1859.” That translates to “Zions Church, First German Methodist Church in the City, Founded 1843, U. Vergrossert, Built 1859.”

According to a report from the Kentucky Archaeological Society, the building is much older than the inscription suggests. “The first story of the church was built in 1842 and in 1846 a single story parsonage was added at the rear,” the report reads. “A second story was added in 1859.” That means the oldest part of the building is now 170 years old.

The report also noted that once the congregation moved, the structure was adapted into space for civic and religious groups and eventually a cigar box factory.

The church shown boarded up in March 1980. (High Foshee / NRHP)

According to documents filed with the National Register of Historic Places, the church is one of three important area churches:

Three early churches—First German Methodist Episcopal, 218 South Clay Street; St. John’s German Methodist Episcopal, 221 South Hancock; and Shelby Street Methodist Episcopal, 216 South Shelby—are rare Louisville examples of vernacular Greek Revival, ecclesiastical architecture.

According to a real estate listing for the property, the church contains a total of 6,184 square feet—3,279 square feet on the first floor and 2,905 square feet on the second including the choir loft.

According to Otts, the couple paid $500,000 for the building under a new company called The Holy Goat LLC, a reference to the adjacent Nanny Goat Strut Alley. Exact details on what the new owners plan for the building remain scant, but we’ll be sure to keep a close watch on this one.

[Top image by Branden Klayko / Broken Sidewalk.]
Fresh local produce in January? Vertical indoor farm at the West Louisville FoodPort will make it happen

One of the nation’s leading vertical indoor farming companies, FarmedHere, today announced it would construct a major project at the West Louisville FoodPort. The Chicago-based company plans to invest $23.5 million in the 60,000-square-foot vertical farm.

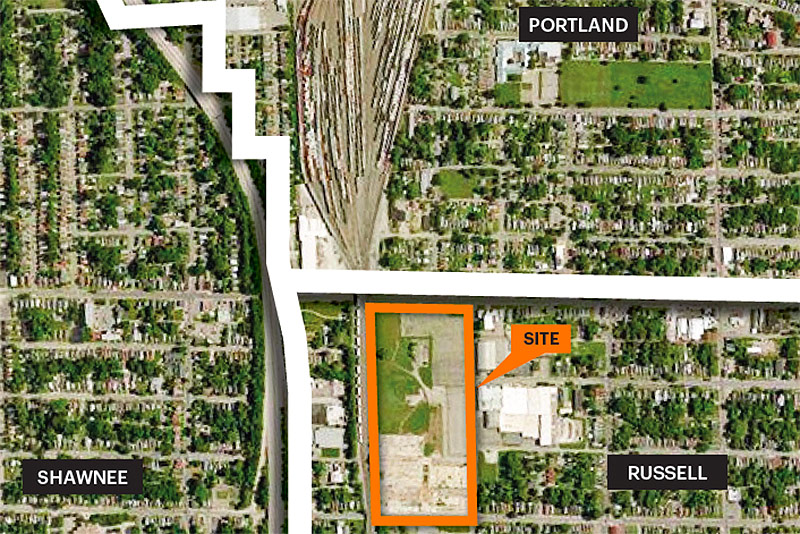
The FoodPort's site at the confluence of three neighborhoods. (Courtesy Seed Capital KY)
The FoodPort’s site at the confluence of three neighborhoods. (Courtesy Seed Capital KY)

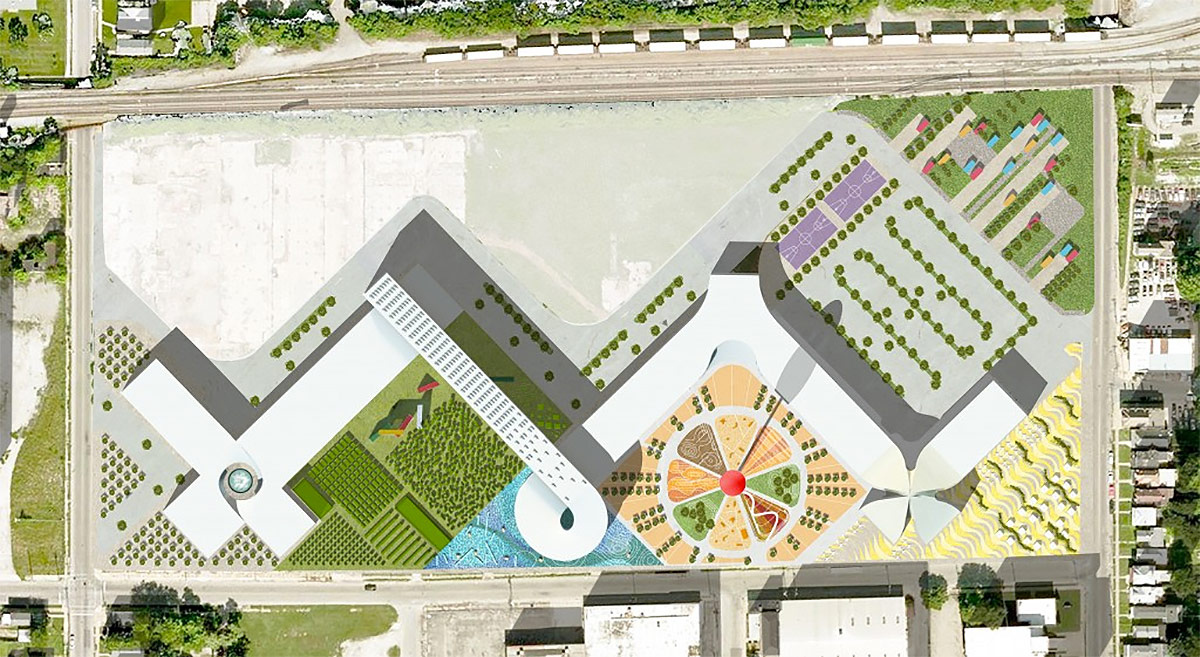
Developed by nonprofit Seed Capital KY, the FoodPort will be built on a massive vacant site (formerly a tobacco processing factory) bound by Market Street, 30th Street, Muhammad Ali Boulevard, and railroad tracks in the Russell neighborhood. Rotterdam-based architecture giant OMA, the Office for Metropolitan Architecture, unveiled its master plan designs for the project last year.

OMA's site plan for the West Louisville FoodPort. (Courtesy Seed Capital KY)
OMA’s site plan for the West Louisville FoodPort. (Courtesy Seed Capital KY)

OMA’s design shows outdoor farming, a farmers market, and other public spaces separated from the logistical trucking side by a zig-zagging modern structure that provides space for food businesses like FarmedHere. The FoodPort covers a 24-acre site with food-related initiatives and businesses where food from local farmers can be distributed to area restaurants and groceries.

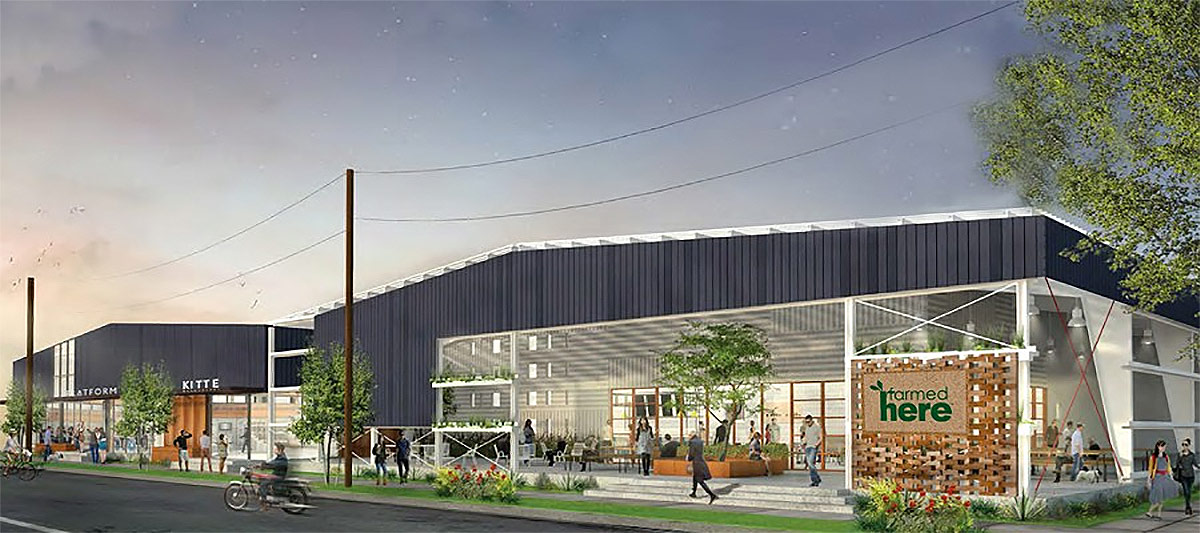
A rendering of the proposed indoor farm. (Courtesy FarmedHere)

A rendering released by the company along with a press release shows a distinctly more generic industrial building than OMA’s designs from last year. It’s unclear whether this image is meant to visually depict the planned Louisville facility or represent one of FarmedHere’s typical vertical indoor farms. Details on where the farm would be located within the FoodPort have not been released.

An indoor vertical farm in operation. (Courtesy FarmedHere)

FarmedHere’s facility will include ten rows of vertical growing beds and logistical space for sorting and packaging microgreens, herbs, salad dressings, and baby food, among other products. The pesticide-free farm uses LED lights to create a controlled growing environment that can provide fresh produce all year long.

According to the company, such a vertical indoor farm “produces 15 times as many crop cycles annually as traditional farming and uses 97 percent less water.”

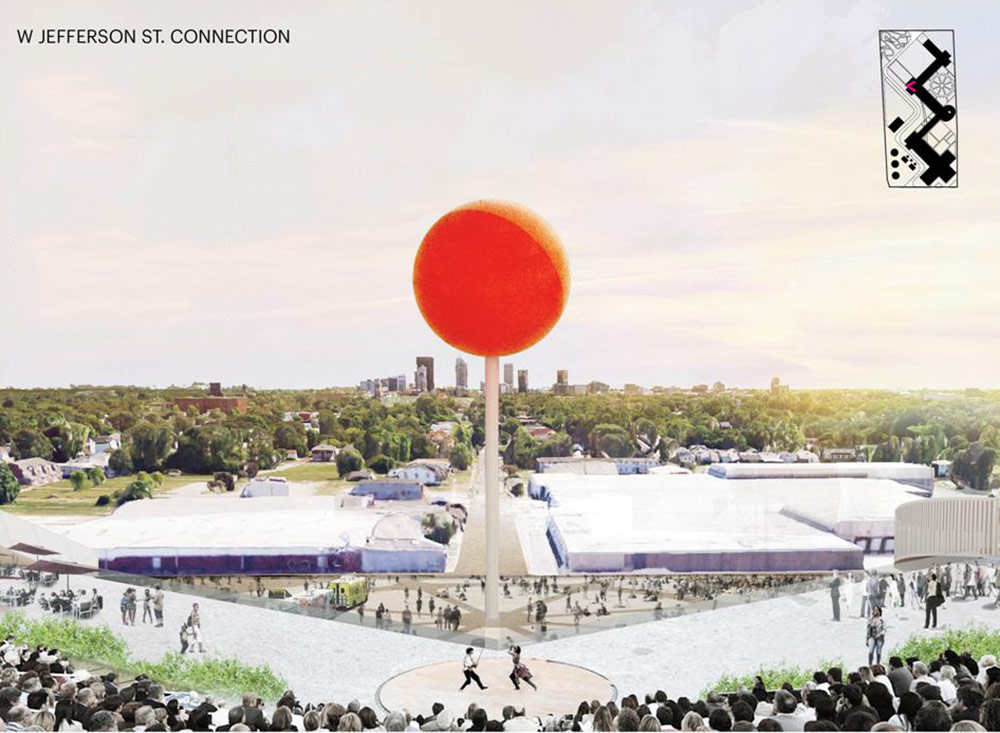
Rendering from OMA's original plan. (Courtesy Seed Capital KY)
Rendering from OMA’s original plan. (Courtesy Seed Capital KY)

“This new location will bring us one step closer to reaching our goal of building vertical farms in 18 cities across the country and feeding 75 percent of the United States’ population,” Matt Matros, CEO of FarmedHere, said in a statement.

Rendering from OMA's original plan. (Courtesy Seed Capital KY)
Rendering from OMA’s original plan. (Courtesy Seed Capital KY)

The company said in a press release that the indoor farm will provide “Louisville and the approximately 18.2 million people living within 200 miles…access to freshly harvested, USDA certified organic and pesticide-free produce 365 days a year.” At their first facility, built in 2010 in Chicago, FarmedHere said it supplies grocery stores such as Whole Foods and a regional version of Kroger.

Rendering from OMA's original plan. (Courtesy Seed Capital KY)
Rendering from OMA’s original plan. (Courtesy Seed Capital KY)

FarmedHere today also received preliminary approval from the Kentucky Economic Development Finance Authority (KEDFA) for up to $400,000 in performance-based tax incentives for the project through the Kentucky Business Investment program. The project aims to hire 40 people from the community with an average wage of $18 per hour.

Construction of the West Louisville FoodPort will likely begin in August 2016 with a goal of being operational by fall 2017. Other businesses that will operate from the FoodPort include The Weekly Juicery, Piazza Produce, and Just One Organics. A controversial waste-to-energy plant was nixed from the proposal last year after community outcry.

[Top image of an indoor vertical farm in operation courtesy FarmedHere.]


Majority of U.S. mayors would back bike lanes over parking or passing lanes

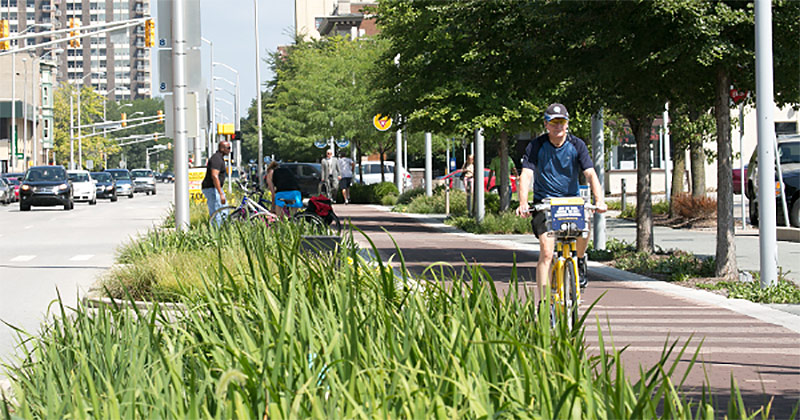
The Indianapolis Cultural Trail, a massively successful reuse of downtown passing lanes. (Courtesy PeopleForBikes)

Road space needs to come from somewhere. And with the nation’s infrastructure budgets buckling under road maintenance costs, there’s growing consensus that ever-wider roads are infeasible.

Instead, a large and bipartisan majority of U.S. mayors agree, cities should be taking the opposite approach: making their entire systems more space-efficient, cost-effective, and economically productive by adding bike facilities in place of extra passing lanes or on-street parking spaces.

That’s according to the 2015 Menino Survey of Mayors, released this week by the U.S. Conference of Mayors. The survey was of 89 mayors from “cities of all sizes and affluence.”

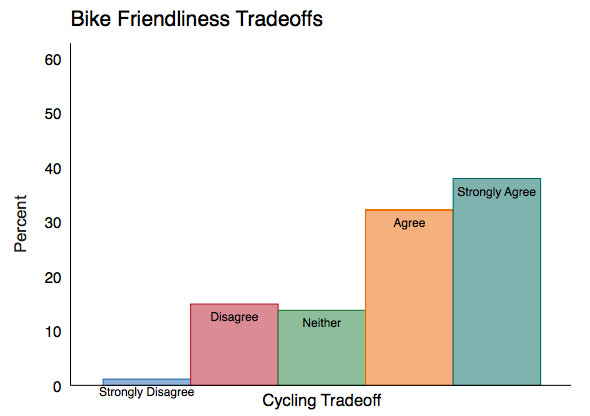
Here’s the relevant survey question:

Figure 6. Cities should make their roads more accessible to bicycles even if it means sacrificing driving lanes and/or parking. (Courtesy U.S. Conference of Mayors)

That’s 70 percent of U.S. mayors who believe that biking networks are important enough to U.S. roads that it’s worth converting parking and driving lanes to make room.

This strategy for connecting bike networks into a usable “minimum grid” (to borrow a phrase from our neighbors in Toronto) isn’t just about bike infrastructure. Removing passing lanes, as Indianapolis did to create its downtown Cultural Trail, can lower auto speeds. Removing street parking, as Salt Lake City did to create its first downtown protected bike lanes, can actually help a district become less dependent on parking for its economic success by improving the alternatives to driving.

Both of those projects, which also went hand in hand with big improvements to walking, led to significant upticks in retail growth and neighborhood investment.

Democratic mayors overwhelmingly prioritize biking, while GOP splits evenly

“Cycling infrastructure emerged as a strong priority for mayors, garnering strong support overall and support — albeit in varying degrees — from mayors of both parties,” the Conference of Mayors wrote in its analysis of the new survey.

There was a clear divide between Democratic and Republican mayors. About 80 percent of Democratic mayors agreed with the statement about prioritizing biking improvements over the status quo. GOP mayors split on the question 43 percent to 43 percent, with the remaining 14 percent undecided.

01-mayors-opinion-on-bikes
Figure 7. By Partisanship: Cities should make their roads more accessible to bicycles even if it means sacrificing driving lanes and/or parking. (Courtesy U.S. Conference of Mayors)

One in five mayors puts “bicycle friendliness” among top three infrastructure priorities

The survey also asked mayors to say what they’d do with a pair of unrestricted infrastructure grants: one “small” and one “large.”

For the “small” grants, biking and walking investments came in first. They topped parks, roads, city buildings, and eight other possible infrastructure investments as low-cost, high-return projects.

“Interestingly, responses did not vary significantly by city size,” the report noted.

For a hypothetical “large” infrastructure grant, biking and walking rated as lower priorities, though the generic “roads” answer came in a close second to mayors’ single most common priority: “mass transit.”

03-mayors-opinion-on-bikes

And when the survey asked mayors to name their top three areas for new infrastructure spending, one in five of the mayors surveyed said “bicycle friendliness” was in their top tier.

Mayors are unique among almost all government officials in the breadth of issues they must care about and the depth of knowledge they must have about their city. So maybe it’s no surprise that biking investments tend to stand out to them as good ideas: they reduce public transportation costs, recruit young workers, clean the air and boost public health.

Not everyone in cities sees how those benefits fit together on city streets. Then again, few people see cities the way good mayors must.

[Editor’s Note: This article was cross-posted from PeopleForBikes’ Green Lane Project blog. Follow them on Facebook and Twitter.]

Kentucky Transportation Cabinet drops plans to widen Chenoweth Lane with a turning lane

The Kentucky Transportation Cabinet (KYTC) will not pursue a plan to widen Chenoweth Lane in St. Matthews with a center turning lane. That option was being studied along with a number of other options that could bring new sidewalks, a bike trail, drainage work, or no change at all.

In a letter from KYTC to a constituent, Michael W. Hancock, acting secretary of the KYTC, said the widening is off the table. “A project team meeting was held recently to review the public comment forms received as a result of the meeting,” he wrote, referring to a public meeting held last November to gather community input on the project. “The decision was made to remove the 3-lane widening of Chenoweth Lane from consideration.”

He cited the following reasons:

  1. The capacity analysis and future traffic growth do not warrant three lanes throughout
  2. Public opposition to the widening
  3. The benefits will not be realized by the cost of a three lane widening project (Cost/Benefit ratio)

“Other alternatives are still being considered and will be presented at the next public meeting at the end of February,” Hancock said in the letter. “Moving forward, KYTC will work with the Kentuckiana Regional Development and Planning Agency (KIPDA) to remove any reference to ‘widening’ in the project description.”

This is a big win for neighborhood group STOP the Widening of Chenoweth Lane which had organized support against the widening—and against any change at all fearing KYTC’s design approach could turn the road into a highway setting, with or without widening.

Community leaders held a public meeting earlier this month to discuss the project design with new research. They had invited KYTC officials, but no one showed up.

“We had advocated for taking [the] three-lane road widening off the table, while continuing to study possible pedestrian, bicycle, and drainage improvements,” Ninth District Councilman Bill Hollander wrote to Broken Sidewalk in an email.

Hancock denied the notion that KYTC entered the project with any notion of what the outcome might be. “Contrary to popular belief, there were no preconceived notions of what improvements would be carried forward and developed into plans,” he said. “Other than conceptual renderings, no work had begun on any improvements prior to the public meeting.”

Read the full letter below, with the constituent’s name redacted:

Dear Ms. XXXXXXXX,

Your correspondence to Governor Bevin was forwarded to the Kentucky Transportation Cabinet (KYTC) for response regarding the widening of Chenoweth Lane in Jefferson Co.

As you are already aware, a public meeting was held in November 2015 to gather input from local residents regarding potential improvements to Chenoweth Lane. Some of the potential improvements being considered and presented at the meeting were: sidewalks, bike lanes, a shared use path, drainage improvements, turn lanes, increased traffic capacity, etc. Contrary to popular belief, there were no preconceived notions of what improvements would be carried forward and developed into plans. Other than conceptual renderings, no work had begun on any improvements prior to the public meeting. The meeting was a vehicle for KYTC to present the existing conditions and gain some knowledge from those who live in the surrounding neighborhoods or those who are regular users of the roadway.

A project team meeting was held recently to review the public comment forms received as a result of the meeting. The decision was made to remove the 3-lane widening of Chenoweth Lane from consideration for this project because 1) the capacity analysis and future traffic growth do not warrant three lanes throughout, 2) public opposition to the widening, and 3) the benefits will not be realized by the cost of a three lane widening project (Cost/Benefit ratio). Other alternatives are still being considered and will be presented at the next public meeting at the end of February. Moving forward, KYTC will work with the Kentuckiana Regional Development and Planning Agency (KIPDA) to remove any reference to “widening” in the project description.

We hope this information is helpful.  If you need additional information, please feel free to contact Matt Bullock, Chief District Engineer at our District 5 Office in Louisville at 502-210-5400.

SENT ON BEHALF OF THE KENTUCKY TRANSPORTATION CABINET

MICHAEL W. HANCOCK, P.E., ACTING SECRETARY

[Top image of Chenoweth Lane courtesy the Kentucky Transportation Cabinet.]

Chart of the Day: Other cities look to Louisville for policy inspiration

    5

    Louisville is one inspirational place. And new data from the 2015 Menino Survey of Mayors compiled by Boston University’s Initiative on Cities proves it. The report was released this week by the U.S. Conference of Mayors and includes survey results from mayors in 89 cities, both big and small.

    The survey asked mayors to list cities where they look for inspiration. Some of the best ideas are recycled or outright stolen, after all.

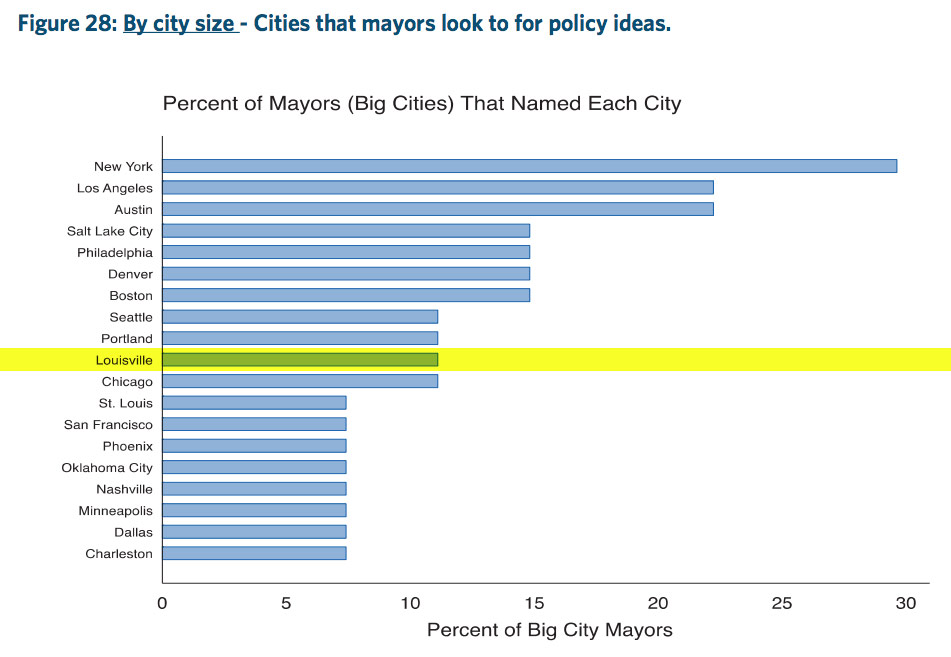
    “Mayors obtain policy ideas from a wide variety of cities,” the report reads. “As in 2014, mayors were asked about the cities from which they have gleaned three recent policy ideas.” The resulting chart, shown above, lists the percentage of mayors who listed each city as a source of inspiration. The survey notes that the chart “depicts every city mentioned more than once and thus excludes a wide array of cities that exactly one mayor mentioned.”

    And what do you know, Louisville is in good company, cited as a source of policy inspiration by about nine percent of mayors. It sits alongside Portland, Ore., San Francisco, and Seattle for frequency of mention in the survey. Louisville tops other poster cities like Nashville, Cincinnati, Minneapolis, and Pittsburgh. Mayors in other cities seem to like something we’re going here.

    In further analysis of survey results from only “big city” mayors, Louisville performs even better, raking in about 11 percent of mentions. “City size does impact where mayors look for ideas,” the report reads. “Big city mayors named New York, Los Angeles, Austin, Salt Lake City, Philadelphia, Denver, Boston, Seattle, Portland, Louisville, and Chicago more than 10 percent of the time.”

    02-louisville-gives-inspiration

    “Mayors are generally drawn by best practices and success stories in specific policy areas,” the report notes. “The most commonly cited motivation—highlighted by a whopping 68 percent of mayors—was “policy specific.” These mayors believed that their chosen city approached a specific policy area in a way that they perceived to be especially effective or innovative.”

    Here are details about changes to seven TARC bus routes that go into effect this Sunday

    (Courtesy TARC)
    (Courtesy TARC)

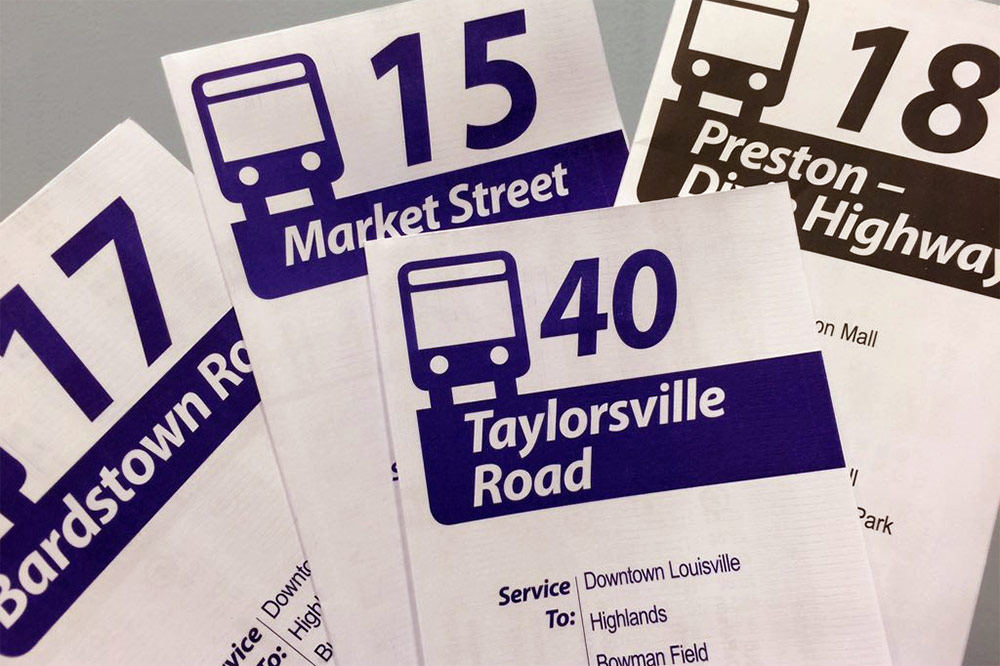
    Changes to seven bus routes in Louisville go into effect this Sunday, January 31, the Transit Authority of River City (TARC) has announced. “Most of the service changes involve minor adjustments to pick-up times in response to traffic conditions and delays,” TARC said in a press release. Here’s the full list of service changes.

    • Route #4 – Fourth Street — Between Central Ave. and the end of the route, southbound trips will arrive 2-3 minutes later and northbound trips will arrive 2-3 minutes earlier on all days. Pick-up times north of Central Ave. will NOT be affected.
    • Route #15 – Market Street — Lagrange Road trips will be adjusted to serve the Hurstbourne Green development, UPS Drive and Ormsby Station Rd, including Teleperformance USA and Charter Communications. Eastbound trips from Lagrange Road will travel into the development via UPS Drive, Ormsby Station Road and Hurstbourne Parkway. Service will be provided seven days a week on this new routing. Departure times are adjusted slightly on only a few trips.
    • Route #17 – Bardstown Road — There are minor time adjustments at stops on weekdays only: Westbound trips leaving Fern Creek at 11:02 am and 2:56 pm will depart five minutes later.  The eastbound trip leaving 8th and Jefferson Street at 12:06 pm will also leave five minutes later. Afternoon arrival times will change slightly on Bardstown Rd. between Douglass Blvd. and Fern Creek. Check schedule for adjusted arrival times.
    • Route #18 – Preston-Dixie Highway — Trips to and from Valley Village will reroute over Dixie Highway to Watson Lane where a new bus loop with a park & TARC lot is located. Valley Village trips will no longer operate on Pendleton Road, Kinross Blvd., Ethan Allen Way, Tennis Blvd., Nathan Hale Way and Sandray Blvd.
    • Route #40 – Taylorsville Road — Three weekday eastbound trips will leave five minutes later. The 12:41 pm trip leaving 8th Street at Jefferson Street will depart instead at 12:46 pm.  Trips leaving 8th Street at Jefferson at 5:26 pm and 6:06 pm will also leave five minutes later.
    • Route #21 – Chestnut Street — Arrival times at stops will change slightly to reflect ongoing delays due to traffic conditions. Almost all trips are adjusted to allow additional travel time between stops. Check schedule for adjusted arrival times.
    • Route #65X – Sellersburg Express — Afternoon trips southbound from Ivy Tech will leave five minutes earlier to help address schedule delays due to congestion on I-65 during the Bridges Project. The trips leaving Ivy Tech at 3:45 pm, 4:50 pm and 5:25 pm will depart five minutes earlier at 3:40 pm, 4:50 pm and 5:20 pm.

    You can plan your transit trip on TARC’s website.


    Looking at Louisville’s apartment boom with four different maps

    While the news cycle typically talks about individual development projects individually, looking at the bigger picture can reveal larger trends or insights. For instance, since we published our map roundup last week of the 16 biggest multi-family projects taking shape around Louisville, readers have been blown away with just how much development activity is happening around the core city. (Plus, don’t miss my discussion of the apartment boom with WFPL’s Jacob Ryan.)

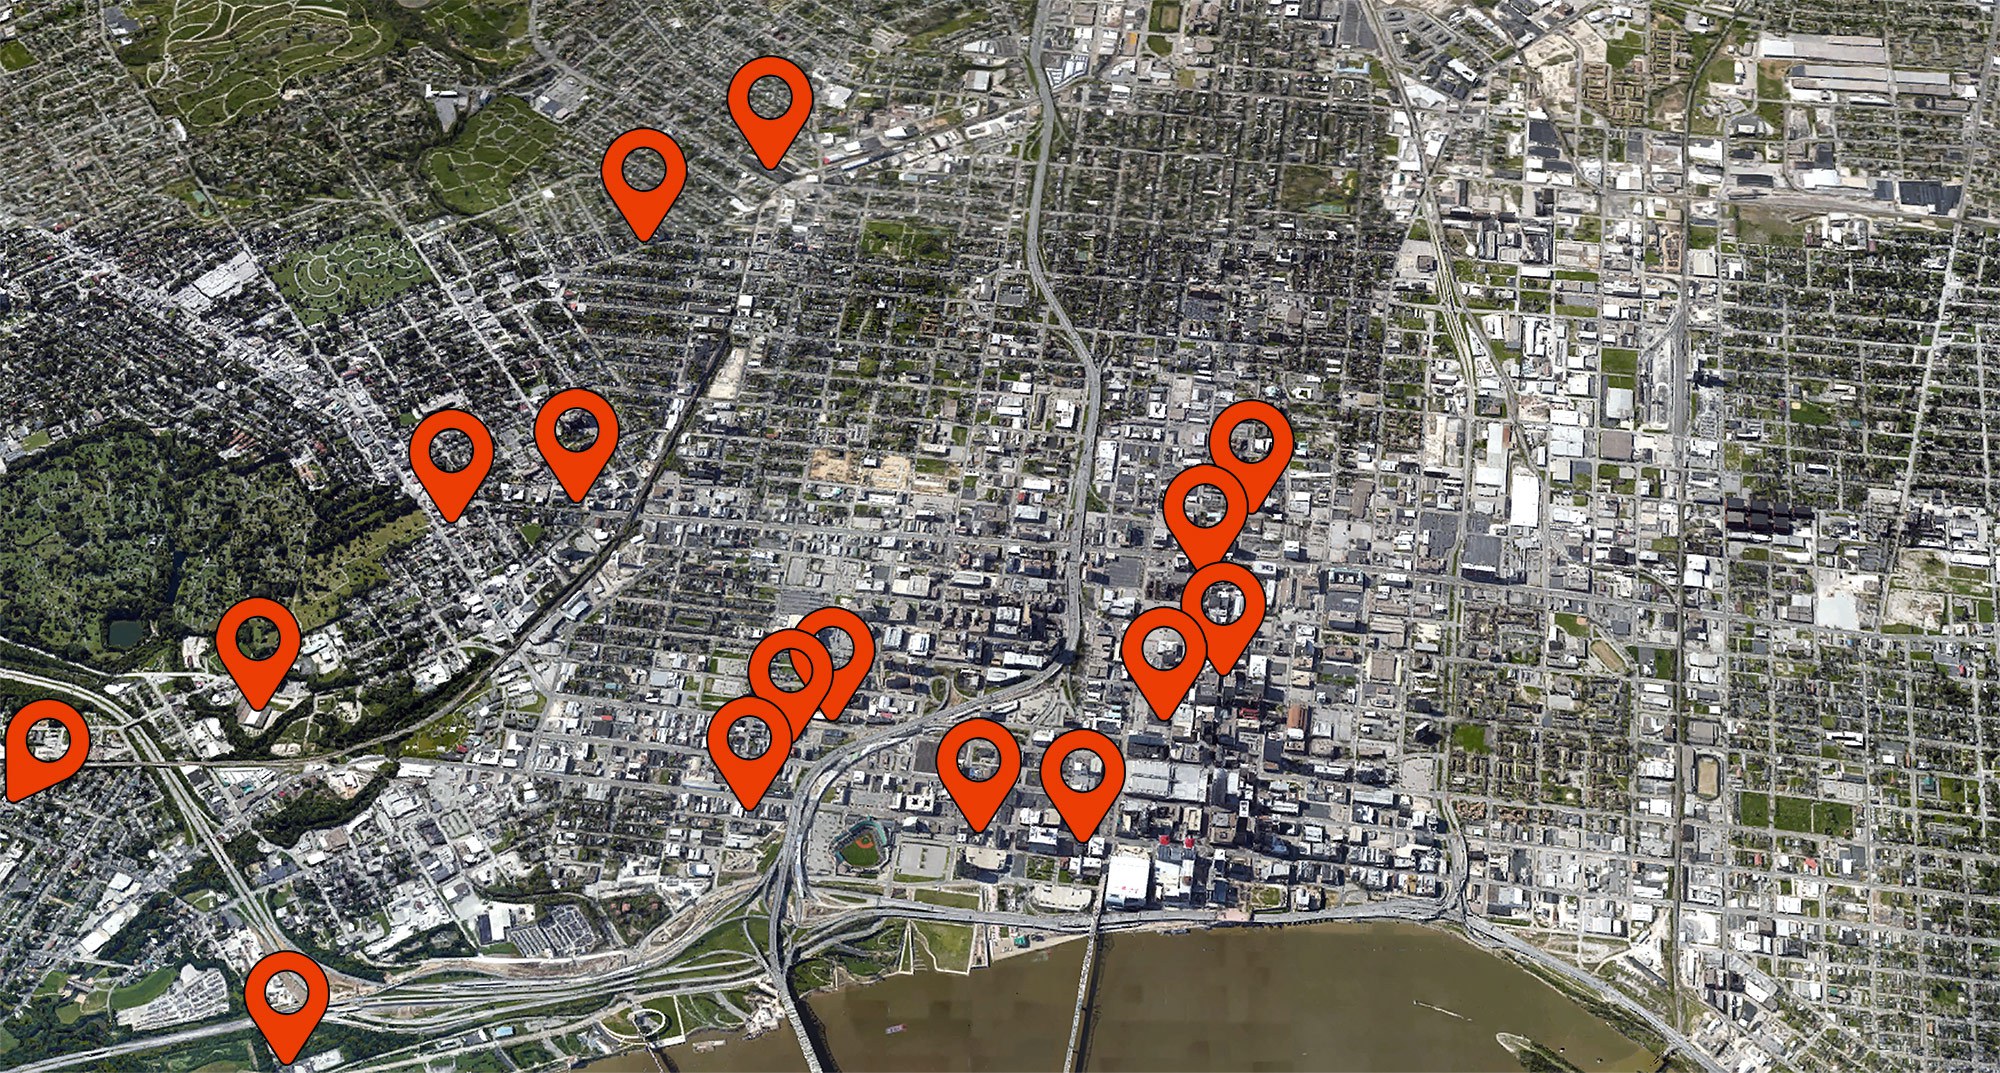
    Map showing the 16 largest multi-family projects currently underway in Louisville. (Montage by Broken Sidewalk)
    Map showing the 16 largest multi-family projects currently underway in Louisville. (Montage by Broken Sidewalk)

    What else have we learned? What’s clear about the locations developers are choosing to build apartments is, above all other things, walkability. (There are a lot of other things to be learned as well, including how Old Louisville and anywhere west of Fourth Street is noticeably lacking in multi-family development, but that’ll have to wait for another day.)

    While a bunch of projects are clustered in Downtown (itself a fairly walkable place), there’s a clearly visible ring of multi-family projects in Louisville’s inner ring suburbs, from Germantown to Clifton to the Original Highlands to Phoenix Hill. It’s clear that developers are banking on our interest in an urban lifestyle, harnessing the power of density to create places that support local businesses and don’t require getting behind the wheel for every little errand.

    Those 16 projects will fundamentally reshape the city’s built environment, adding more people to areas that have had a stagnant population for decades. They will be able to support more businesses and more transit and, potentially, could fuel another round of multi-family development that follows the growth of core neighborhoods.

    But where are Louisville’s residents—specifically renters who might be interested in these new developments—living today? Here are three more ways to look at it.


    04-louisville-renters-map
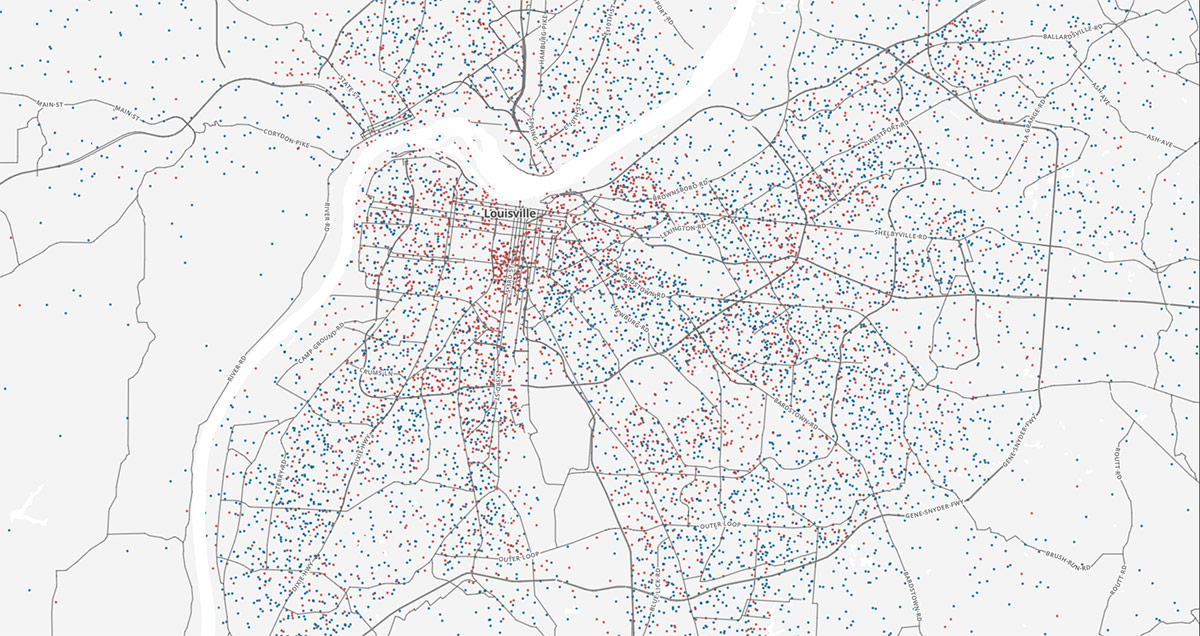
    Each red dot is 25 Louisville renters and each blue dot is 25 owner-occupied units. (Courtesy Ken Schwencke)

    First, journalist and web developer Ken Schwencke has created a map showing every single person renting an apartment in the United States (or groups of 25 of them) with a red dot. If you zoom in to Louisville, you can see that there’s a fairly even scattering of renters across the county with a couple hotspots, most notably Old Louisville.

    CityLab’s Laura Bliss reported on the mapping project last summer, focusing on the nation’s affordable housing crisis. Back in July, the Census Bureau reported that the national “homeownership rate has declined to 63.4 percent, the lowest it has been since 1967,” Bliss wrote.

    The red (rental) hotspots in cities across the region are predominantly in urban areas. (Courtesy Ken Schwencke)
    The red (rental) hotspots in cities across the region are predominantly in urban areas. (Courtesy Ken Schwencke)

    Shwencke’s map, “Where the Renters Are,” uses 2013 American Community Survey data and each red dot represents 25 people renting across the country, randomly placed within their respective census tracts. The blue dots, by comparison, show owner-occupied units.

    Bliss pointed out that in places like Louisville—and the South in general, where homeownership rates have remained among the highest in the nation—the homeownership rate is also in decline. “A drop in homeownership isn’t inherently bad,” Bliss wrote. “Homeownership rates can decline alongside economically positive developments—like young people moving out of their parents’ homes and into their own apartments.”

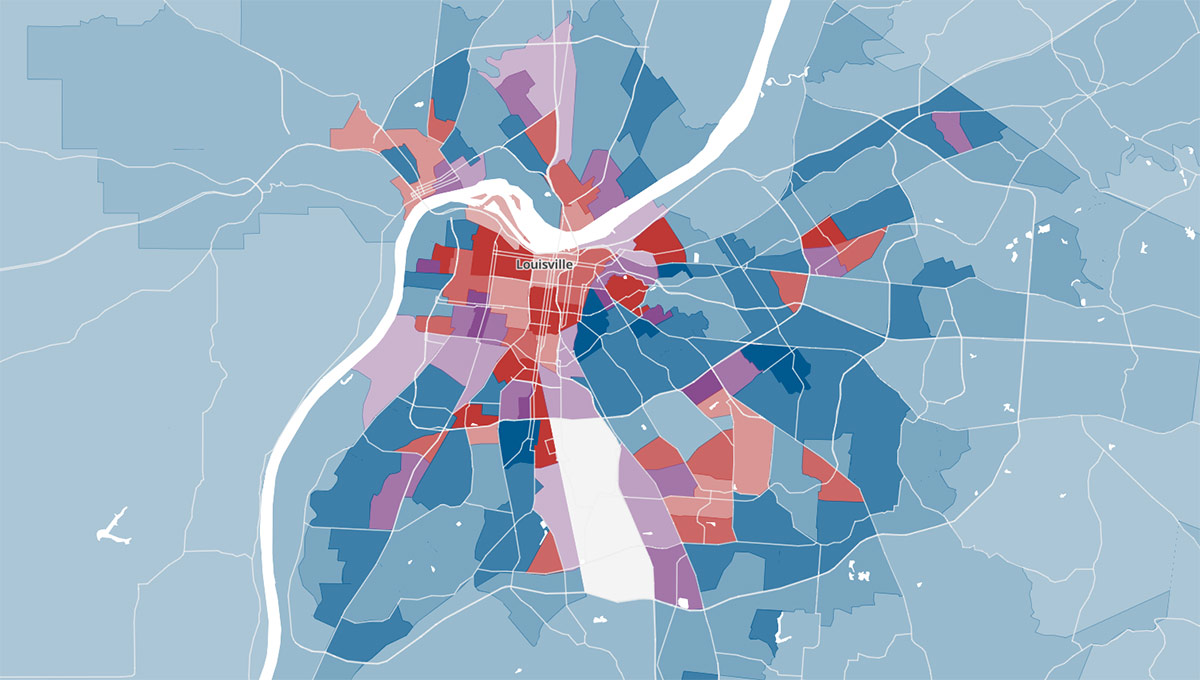
    Map showing census tracts where the majority of population rents (red), owns (blue), or where the rate is about even (purple). (Courtesy Ken Schwencke)
    Map showing census tracts where the majority of population rents (red), owns (blue), or where the rate is about even (purple). (Courtesy Ken Schwencke)

    Bliss sounds a warning about rising apartment costs, which Louisville is seeing with its new stock currently under construction: “About half of all renters pay more than 30 percent of their incomes toward housing,” she wrote. “Add a debt crisis on top of that, and you have a nation of people who not only lack the savings to imagine buying a home, but who can’t even reasonably afford their current apartment.”

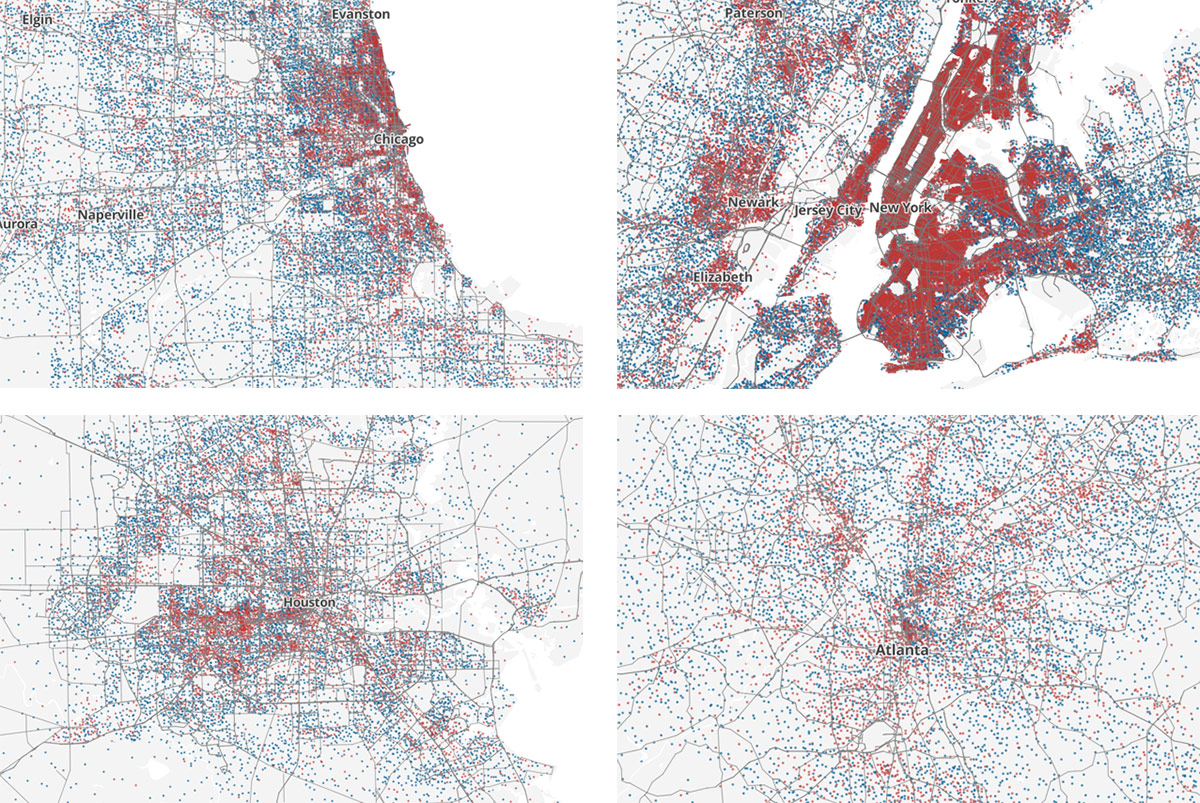
    Clockwise from top left: Chicago, New York City, Atlanta, and Houston. (Courtesy Ken Schwencke)
    Clockwise from top left: Chicago, New York City, Atlanta, and Houston. (Courtesy Ken Schwencke)

    Another dynamic happening in Louisville is that this wave of apartment buildings is really the city’s first apartment boom, where other cities have already had a lot of such development. Developers are often quick to find the largest return on their investment and seek the highest rents a market can bear. With Louisville relatively underdeveloped in urban apartments, there’s plenty of room at the top for expensive units. Moving forward as these units come online, it will be crucial to watch how the market responds.

    It will also be interesting to watch future Census data to see if there’s a clustering of renters once more apartment buildings come online. Right now, Louisville looks more like Atlanta or Houston in the maps above, compared to larger metropolises like Chicago or New York.


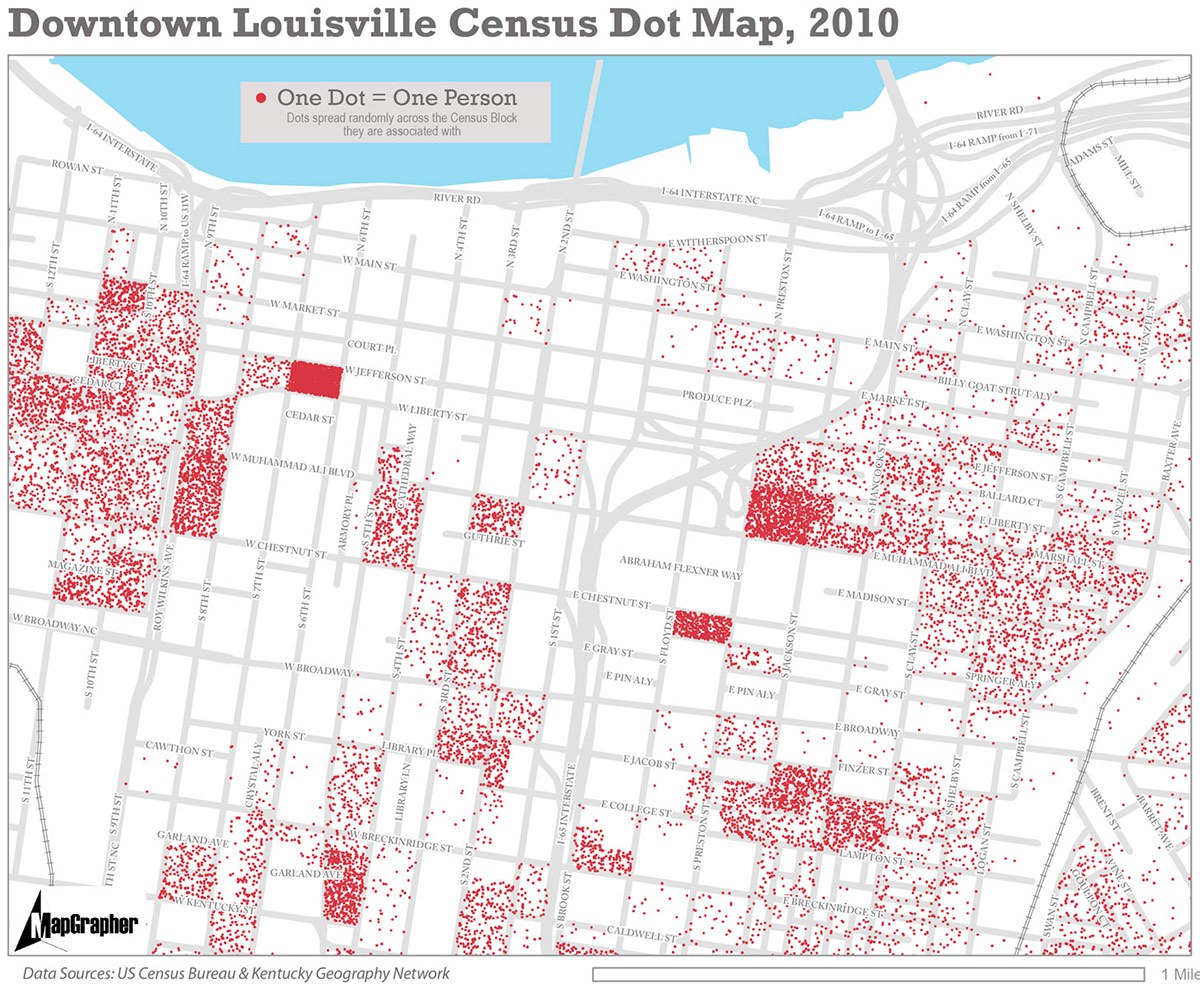
    downtown-louisville-residents-01

    Next, it’s worth revisiting a map we published here last January showing every person living in and around Downtown Louisville. The map was created using Census Data from 2010 by Louisville’s Pat Smith.

    “I think Downtown Louisville badly needs a hearty injection of new residents in the Downtown core (and much needed new multi-unit housing development to make that possible),” Smith wrote in the article. “There are huge gaps in residential buildings across Downtown, and most of the only truly dense Census Blocks from 2010 are public housing towers and corrections centers.”

    As Smith pointed out, the map shows all people residing in the core city, not just people renting apartments. Louisville does have a good number of privately owned condos and some of the densest blocks above are either jails or hospitals.

    The map still shows vast areas of Downtown where no one lives, which brings us to our next map.


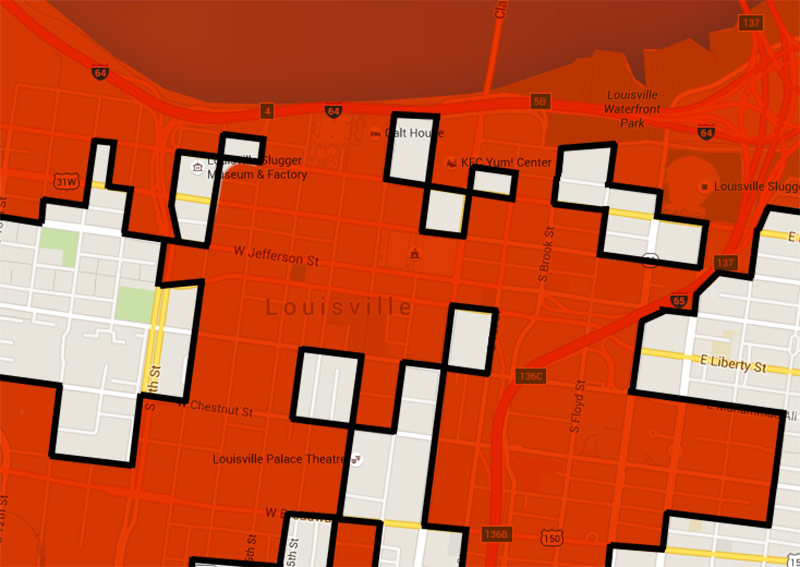
    The Downtown Louisville Home-Free Zone marked in red. (Montage by Broken Sidewalk)
    The Downtown Louisville Home-Free Zone marked in red. (Montage by Broken Sidewalk)

    Last week, Streets.MN’s Adam Miller wrote about his so-called “Downtown Home-Free Zone” showing blocks in Minneapolis where there are no residences. In the map, Miller visualized what what he calls “the main problem” with retail in Downtown Minneapolis: “there are large swaths of downtown in which no one lives.”

    Miller writes that there’s reason to be optimistic with many new projects in the works in Minneapolis—just as in Louisville—but adds that “there will always a be challenge inherent in the fact that we built out the heart of downtown in an era that didn’t require (or maybe even discouraged) mixed use development.”

    We decided to create a similar version for Louisville, above. This rough map was eyeballed from online maps and includes only actual residences (so no jails or hospitals here). While we initially thought the Louisville map would be similar to the Minneapolis version, depicting a hole in the center of town, it appears as though Louisville’s is a bit worse. In Louisville, the “home-free zone” bleeds off the edges of the map in several places and forms a much larger area outside of the city core.

    Now obviously some of the blocks included in the zone are the river, highways, or interchanges, but it still demonstrates the lack of housing in the Central Business District. Many of the blocks where housing does exist, either rental or privately owned, there only a small single building with homes, which inflates the appearance that there are sizeable oases of housing in the map above.

    What conclusions do you draw from these mapping exercises? Share your observations in the comments below.

    [Top image by flickrized / Flickr; montage by Broken Sidewalk.]